DIFFERENTIAL SENSITIVITY/LIMEN IN
- · FREQUENCY
- · INTENSITY
- · TIME
INTRODUCTION
The ear’s extremely wide range of sensitivity is one of the
most striking aspects of audition. The ear is sensitive to range of intensities
from about 0 dB SPL (which is amplitude of vibration of about size of a
hydrogen molecule) to roughly 140 dB (at which pain and damage to the auditory
mechanism ensue).This dynamic range of the approximately 140 dB corresponds to
pressure ratio of 107:1. In other words, the most intense sound pressure that
is bearable is on the order of 10 million times as great as the softest one
that is perceivable under optimum listening condition. In terms of frequency,
humans can hear tones as low as 2 Hz (although roughly 20 Hz is required for a
perception of “tonality”) and as high as about 20 KHz. The frequency and
intensity sensitivities of ear can interact, affecting each other to a greater
or lesser degree. In addition, when duration the duration of sound is less than
about half of a second, it affects both frequency and intensity sensitivity.
Longer duration may be thought of as being infinitely long as far as auditory
sensitivity is concerned.
The ear is able to discriminate small differences in a wide
range of stimuli, i.e. it has a remarkable sensitivity- the ability to detect
very small differences between similar sounds. This ability applies to all
three parameters: intensity, frequency, and time.
DIFFERENTIAL SENSITIVITY
It is the smallest perceivable difference between two
sounds. This quantity is called either the difference limen (DL) or the just
noticeable difference (JND). The DL is the smallest perceivable difference in
db between two intensities (∆I) or the smallest perceivable change in Hz
between two frequencies (∆f).
We may think of JND in two ways.
·
The
absolute difference between two sounds
·
The
relative difference between two sounds
Absolute difference is how much sound intensity is necessary for a typical,
normally hearing person to just detect the presence of a stimulus or it is the
least sound pressure that leads to a sensation of hearing.
Relative difference is obtained by dividing the absolute DL by the value of
starting level. Thus, if the starting level is 1000 units and the DL ∆I/I is
50/1000=0.05. This ratio, ∆I/I, is called the Weber fraction.
The frequency DL ∆f is an absolute difference in Hz, as
opposed to the relative frequency DL obtained by dividing ∆f by the starting
frequency f. Suppose it is necessary to change a 1000 Hz tone (f) by a 3.6 Hz
∆f in order for a particular subject to just detect the frequency difference.
His absolute frequency DL is thus 3.6 Hz, whereas his relative DL is 0.0036.The
situation is different, however, for the intensity DL, because we measure in
dB.
DIFFERENTIAL SENSITIVITY FOR INTENSITY
Successive and simultaneous comparison
There are two quite distinct tasks can be posed to the
listener when investigating the discrimination of changes in intensity. The
listener’s memory requirements are very different in these two tasks and the
results obtained with these two tasks and the results obtained with these two
tasks are quite different. In the classical approach to intensity
discrimination, the sounds are presented successively to the listeners. In
effect a pair of waveforms, f (t) and K.f (t) are presented. Where K is
constant. The discrimination task amounts to determining the order in which the
pairs are presented, loud soft or soft loud. Since the sounds are presented in
succession, the listener must retain some memory of the first estimate so that
it can be compared with later estimate.
A second way to study intensity discrimination is to require
the listener to compare at least two sounds that are presented simultaneously.
The memory processes required minimal. The listener was asked to compare at
least two spectral regions of a single sound. Often, two sounds are presented
in one of the spectral levels are the same, in other, they differ. Green, Kidd
& Picardi (1983) have shown that interstimulus interval has very little
effect on the result obtained in such experiments. Their results also showed
that simultaneously intensity comparison were often more sensitive than
successive comparisons.
FACTORS AFFECTING DLI
1. INTENSITY
WEBER’S LAW
The important concept in psychophysics is Weber’s law
(1934).It states that the value ∆I/I=K i.e. Weber fraction is a constant
regardless of the stimulus.E.g.to lit a number of candles already present you
have to add more to perceive a difference in the amount of light. If 10 candles
are originally lit, then only one more lit will produce JND of light. Thus,
absolute value of DL increased from 1 to 100 where as K remains constant at 0.1
(1/10, 10/100, 100/10000).
Fetcner (1960) criticized Weber’s law and reported that the
constant fraction decreases as the base intensity increases, which is called
near miss Weber’s law.
Reisz (1928) observed that ∆I/I decreases with increase in
sensation level. He reported differential sensitivity for intensity for a wide
range of frequency (35 Hz to 1000Hz) and sensation level (0 to 100 dB). He used
amplitude modulation to determine DLI. The threshold determined by listeners
adjusting the amplitude until they could just hear fluctuation in amplitude.
The intensity difference between two tones was taken as measure of DLI. Results
showed ∆I/I is frequency dependent as it becomes smaller from 35 Hz to 1 KHz.
Above this frequency, Weber fraction remains constant above 20 dBHL.
FIG.1
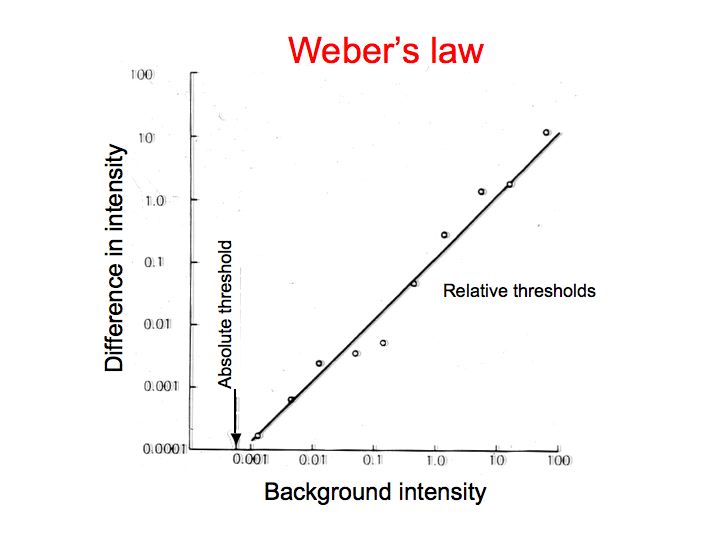
PURE TONE INTENSITY DSCRIMINATION
Some experiments relating to the near miss Weber’s Law:
A number of researchers have shown the Weber’s law does not
hold for DLI .Instead, it is found that if ∆I is plotted against I, a straight
line is obtained with a slope of 0.9. Thus discrimination improves at high
levels. This has been termed near miss to Weber’s law.
Adding high pass noise generally decreases or eliminates
near miss and data are consistent with Weber’s law that is ∆I/I becomes
independent of the standard (Viemeister 1972, Moore & Raab 1974, Florentine
1983).
Weber’s law is characterizes the behaviors of single channel
and head near miss results from intensity dependent spread of excitation,
primarily to frequency region higher than that of standard. If cochlear damage
is moderate, the response to the standard of a channel tunes above the frequency
of the standard may be normal, that is when the OHC damaged to low frequency
falls of tuning curves essentially normal. Thus spread of excitation may be
normal, resulting in normal intensity discrimination. If the damage is severe
at frequency regions above the frequency of the standard, as in the cases of
IHC damage, the response of the channels turned to these regions will be
abnormal or non existent. Then ∆I/I will be impaired.
2. FREQUENCY
Walt Jessteadt, Craig C Wiet, David M Green (1976) studied
the intensity discrimination as a function of frequency and sensation level.
They used pulse sinusoids of various frequencies (200-8KHz) is sensation level
of 5 to 80 dB. Intensity discrimination was measured at intensities of 5, 10,
20, 40, & 80 dBSL for frequencies 400, 600, 800, 1000, 2000 and 8000 Hz.
Subjects tested at lowest frequency and moved towards the high frequency from
high to low sensation level.
Results showed ∆I/I decrease linearly as a function of SL
which is described as near miss to Weber’s law. But no effect of frequency and
no interaction of sensation level with frequency. Results of this study
differed from several previous studies. Previous studies Mc Gill et al (1968),
Campbell et al (1967) found at low levels DLI is non linear. This study found
clear derivation of DLI from linear function only for signals less than 5 dBSL.
Mary Florentine (1983) studied how intensity discrimination
depends on the test frequency, the level and a subject’s high frequency
hearing. She performed three experiments.
1. In the first experiment intensity discrimination of
pulsed tone was measured as a function of level at 1 & 14 kHz.
2. In the second experiment intensity discrimination was
measured for a 1 kHz tone at 90 dBSL as a function of the cut off frequency of
a high pass masking noise.
3. In the third experiment, threshold from 6 to 20 kHz and
intensity discrimination for a 1 kHz was measured.
To examine the frequency dependency of intensity DLs and
established the DLs as a function levels, the measurement made at many levels
from the threshold of audibility to the near threshold of discomfort. To show
the effect of frequency, the DLs were measured at 1 and 14 KHz. At each SL
several increments were chosen to yield 60 to 90% correct responses. The
subject’s task was to press the button corresponding to the interval in which
the more intense stimulus was presented.
RESULTS:
DL improved less with increasing level at 14 KHz than at 1
KHz.
DLs at 14 KHz are clearly larger than the DLs at 1 KHz
except at the lowest sensation levels.
All subjects showed improved DLI with increasing level at 1
KHz but little improvement with increasing level at 14 KHz.
DISCUSSION: DLs at high levels are smaller for 1 KHz tone than for
14 KHz tone because the 1 KHz tone spreads its excitation over a wide rage
especially towards the high frequency.
.
3. EFFECTS OF PHASE DIFFERENCE OF STIMULUS ON DLI
Green and Mason 1985 compared the detection of an increment
in the central component of a multi tonal complex in two phase condition. In
the first the phase of all components of the complex were fixed. When it is
fixed the standard stimulus had same wave shape. In the second condition the
phases of each components of the complex were randomly selected for each
presentation and hence the wave form was unpredictable. Only the difference in
the power spectrum distinguishes the standard from standard plus signal. The
results showed that the threshold for these two signals with addition of
another signal were same. Hence it is concluded that the phase of the signal is
irrelevant in detection of DLI.
4. EFFECTS OF STIMULUS VARIABLE ON DLI
The figure shows that the continuous presentation method
(solid circle) was slightly different from those obtained from gated
presentation method. The continuous thresholds are larger at the lowest
sensation level than the pulsed presentation. Thus, the stimulus variable known
to affect the size of the DL (Green and Nachmlas 1979)
5. EFFECTS OF STIMULOUS DURATION ON DLI
Riezes (1928) first studied the effect of duration of the
stimulus on difference limen. This study later followed by Garner and Miller
1944, Henning 1970 and Florentine 1966. These studies repots that the ability
to hear small changes in intensity improves as the duration of the stimulation
increases.
Florentine (1986) summarized the effect of stimulus duration
on DLI suggesting that Dl decreases with shallow slope until duration of 1
second or more is reached, the DL is constant or increases very little with
further changes in duration. The relation holds for frequencies 250, 1000, and
8000 Hz at 40, 65, and 85 dB SPL. Berliner, Durach and Braida (1977) also measured
improvement in the difference limen as signal duration changes from 0.5 to 1.4
seconds. They suggest that the ear has a relatively long integration time for
an intensity increment in sinusoidal signal.
6. MASKING NOISE
(Miller 1947; Viemster 1972; Moore and Raab1974), under most
listening condition there is simple relation between the intensity of a sound
and DLI. For tones in noise background, the Weber function is constant over a
wide range of base line level (Weber law), where as tones presented in
isolation, Weber fraction decreases with increasing level.
7. MEASUREMENT TECHNIQUE
i. Modulation
detection: Listeners are required to detect the presence of slow amplitude
modulation (AM), threshold being taken as the smallest detectable depth of AM.
ii. Increment
detection: Listeners are required to detect a change in the intensity of
standard stimulus. Standard can be presented either continuously or gated with
the increment.
Intensity discrimination at 1 kHz in the presence f high
pass noise:
(Florentine, 1983) To test this DLI at 1 kHz tone at 90 dB
SPL was measured in quiet and in the presence of high frequency noise. These
results suggest that changing the cut off frequency of the masking noise from 6
to 19 kHz decrease the DLI at 1 KHz by a factor of 1.5 to 2.
MODELS
1. SINGLE BAND EXCITATION MODEL
Zwicker (1967): This model is based on excitation patterns
that are derived from masking patterns. It assumes that the acoustic energy is
transformed into pattern of excitation along the basilar membrane. Intensity
discrimination is performed by discriminating changes in the excitation level
that occurs as a consequence of a change on stimulus level.
He worked with AM tones and explained his results in terms
of a non linear growth in the excitation pattern encoded by the stimulus. He
assumed that performance was determined by the critical band in which the
excitation grows most rapidly with stimulus level. He suggested that a change
could be detected whenever the excitation pattern changed some where by 1 dB or
more. At high levels the high frequency side will be produced by relatively
smaller stimulus increments at high levels. In support of this idea, Zwicker
reported that the addition of high pass noise, which masks high frequency side
of the excitation pattern, causes the end for the amplitude modulation at high
intensities to approach that found low levels
2. MULTIBAND VISION OF THE EXCITATION PATTERN:
It is derived by Florentine and Blass (1981) from the
Zwicker model. This assumes that acoustic energy is transformed in to a pattern
of excitation along the basilar membrane.
Intensity discrimination is performed by discriminating
changes in the excitation level that occur as a consequence of a change in
stimulus level. According to this model discrimination is performed in each 24
critical bands and then an optimum decision is formed on the basis of
information in all critical bands.
FIG4
At higher SLs excitation will be above threshold over an
increasingly larger frequency range and more critical bands become usable for
intensity discrimination. Because of this there is better discrimination at
higher intensity levels. At high levels excitation pattern is very broad and
the excitation at frequencies for above the test frequency is important for
intensity discrimination. Thus for example, DLs for intense 1 kHz tone depend
on the absolute threshold at frequencies for above the test frequency.
This model also predicts that DLs at high levels also depend
on frequency. For every high frequencies of sufficient intensity the excitation
pattern will encompass all available critical bands towards the high frequency
and the number of active critical bands will increase little with level. Hence,
information from fewer critical bands is combined for high frequencies than for
mid frequencies. Hence, poor DLI is predicted for frequencies exceeding 8 kHz
than for middle frequencies.
This model is based on five assumptions;
1. The
excitation pattern derived from Zwicker’s masking pattern model.
2. Excitation
level discrimination in each of 24 critical bands is independent of
the excitation level discrimination in other
critical bands.
3. Sensitivity
of excitation level difference within a critical band is independent of
excitation level, i.e. Weber law holds within each critical band.
4. Sensitivity
is same or constant in all critical bands.
5. Information
in critical bands is used according to a decision rule. The single and multi
band version differ only by decision rule, which determine how the available
information is used.
3. NEURAL COUNTING MODEL
Mc Gill and Goldberg (1968) presented an account of
intensity discrimination upon neural counting mechanism. They suggested that
stimulus energies are mapped on the neural impulse whose number fluctuates from
trial to trial even for non varying stimuli. If the mean number of neural
counts were proportional to stimulus energy this would lead to a number of neural
counts generated in response to it non-linearly. This relation can be
characterized as a power function of the form N=K (I/Io).
Luce and Green (1974) assumed that the system counts neural
impulses or monitors their inter arrival times (IAT) over a number of channels.
The IATs are assumed to be independent of one another with a distribution that
is geometric with an additive error. This model of neural activity differs from
the model proposed by Mc Gill and Goldberg, in that it assumed multi-model distribution
of IAT for low frequency sinusoidal stimuli. In this study there are two sets
of predictions.
1. Assuming
intensity discrimination is based on the duration of IATs (timing model)
2. It
is based on the total number of spikes in fixed time (counting model)
The authors have demonstrated that the particular timing
model investigated predicts that ∆I/I increase with intensity, which is an
obvious disagreement with the data.
The key assumptions are that the number of counts is related
to intensity by power law and that the number of intensity and frequency.
Viemeister (1972) has proposed a model to account for the
deviation from Weber’s law in terms of detection of distortion products at
harmonics of the signal frequency. According to this model the near miss
reflects the observer’s use of information from aural harmonics. At high
levels, a given change in stimulus levels (in dB) produces a somewhat larger
change in level (in dB) of one or more of the aural harmonics. He investigated
the intensity discrimination of the pulsed sinusoids (f=950 Hz) in the presence
of various types of filtered noise level was 6dB higher than the tone. He found
little effect with low pass noise whose cut off frequency was 800 Hz, but a
band pass noise with cut off at 1900 Hz both degraded performance at high
intensities with later stimulus Weber’s law was obtained. Moore and Raab (1973)
evaluated the Viemeister’s hypothesis using low levels of noise tonal maskers.
They assessed DLI at low and high sensation levels, i.e. 36 dB and 75 dB. The
DLI of 1000 Hz pure tone was studied under different
conditions.
Results: Experiment using tonal maskers: 1
KHz tone burst was presented together with phase lock 2000 Hz tone of fixed
intensity. Assuming that 2000 Hz stimulus should affect the second aural
harmonics they hypothesized that when 2 KHz tone level is lower than the second
harmonics there should be no or little effect on DLI. When 2 KHz level is
higher than the aural harmonic, the aural harmonic will no longer
provide useful cues, and DLI high levels should be impaired . When these hypotheses were tested 2 KHz tone did not show
any effect on DLI. Thus constant phase does not seen to be important in this
situation, i.e. it is difficult to impair intensity discrimination at high
levels with stimuli which are specially designed to eliminate information
associated with aural harmonics.
Experiments using Noise makers: Viemeister (1972)
demonstrated that low pass noise had little effect on intensity DLs, that high
pass noise produced a deterioration n performance with high intensity levels.
Moore and Raab studied the effect of high pass noise and
wide band noise on DLI. They observed that smaller DLs at high levels than at
low level even though the noise levels are unchanged by the addition of high
pass noise. The noise also reduced decrement in performance at high levels, but
the decrement is not as large as for high pass noise. Thus information at
frequencies above the frequency of the tone does seem to be important for
important discrimination at high levels. However, the failure to eliminate the
near miss compliably with the high pass noise could indicate that information
on the low frequency side was also used. This was investigation using band pass
noise. The result shows that discrimination performance at high levels was
worse than was found for the high pass noise and the subject’s exhibited good
approximation to Weber’s law. Thus it is concluded that both high and low
frequency information taken together, this experiment show that subject’s use
of information on the low frequency side will be more easily reduced when
information on the high frequency side is removed.
Criticism:
According to this study results, explanation of the near
miss in terms of aural harmonics is not appropriate. Zwicker’s model fails to
explain low frequency side of the test tone. It explains only the importance of
high frequency side.
INTENSITY DISCRIMINATION IN NORMAL HEARING AND HEARING
IMPAIRED LISTENERS
Schroder, Viemeister and Melson (1994): According to these
authors depending on the severity and configuration of hearing loss persons
with cochlear loss show normal or elevated Weber function at given SPL, which
is below sensational level because of relatively high SPL, the cochlear hearing
impaired ear may utilize the larger spread of excitation. The recent studies
shows that such cases show near miss (Schluch and Wier 1987, Turmer et al 1989,
Florentine 1993). These studies indicate in cochlear hearing impaired the Weber
fractions at high SPLs are approximately equal to or larger than those from
normal. But at comparable SLs it is smaller than normal.
Comprehensive data, using many test levels and frequencies
are obtained from listeners with flat and higher frequency losses and from
normal hearing listeners. To assess the possible role excitation, the effects
of high pass noise in both cochlear and normal listeners are examined.
FLAT HEARING LOSS
Figure shows results from the two listeners with flat
hearing loss. These listeners had absolute threshold around 40 dB SPL. Weber
fractions obtained in quiet from these two hearing impaired listeners fell near
the mean normal curve in quiet. At 0.3 and 0.5 KHz for listener F1 the Weber
fractions obtained in quiet from these two hearing impaired listeners fell near
the mean normal curve in quiet. At around 0.3 and 0.5 KHz for listeners F2 the
Weber fractions were slightly below the mean curve but still within the normal
range.
Thus, when compared to equal SPLs the Weber fractions, for
these hearing impaired listeners with flat hearing losses are approximately the
same as those from normal hearing listeners. This data suggest that spread of
excitation may be involved in intensity discrimination by these pair of
listeners. The frequencies below 2 KHz the data indicate normal Weber fractions
at high levels and elevation in the Weber fraction produced by the addition of
high pass noise. However it is not clear whether listeners show the near miss.
HIGH FREQUENCY HEARING LOSS
Figures show from the 3 listeners with high frequency
hearing loss. Results at the lower frequencies within the regions of normal
hearing for listeners H1 and H2 were consistent with expectations based on the
normal hearing data. The near miss was evident in quiet for listeners H1 at
0.3, 0.5 and 1 KHz and for H2 at 0.3, 0.5 KHz. Although listener H3 showed the
near miss at 0.3 and 0.5 KHz where normal hearing existed, the case did have
larger Weber fractions than the normal hearing listeners. Except for H1 the
data for test frequencies immediately adjacent to and within the region of loss
showed elevated Weber fractions at high level and for H2 no effect of high pass
noise. This indicates that spread of excitation was not involved in intensity
discrimination at these frequencies. The listener H1 shows normal Weber
fraction in quiet and elevated Weber fractions in high pass noise at 2 and 3
KHz suggesting that despite a steep high frequency loss there was usable
excitation above the test frequency.
DISCUSSION:
When compared the literature Weber fractions obtained for
normal in quiet were in agreement with those reported by the studies. The near
miss to Weber’s law observed at all test frequencies. For the range of
frequencies examined in this study (0.3 to 3 KHz) there was also a trend for
the Weber fraction at high levels to be slightly smaller at higher frequencies.
The addition of high pass noise reduces the DLI. The results were consistent
with the notion that the higher frequencies showed normal Weber fractions and
tented to show the near miss. Those who had elevated threshold at high
frequency showed limited use of excitation and elevated Weber fraction at a
given SPL and tended to show Weber’s law. The data obtained with high pass
noise shows the listener with cochlear impairment shows spread of excitation
and the audiological information was effectively restricted to a very limited
frequency region. This indicates that normal Weber fraction in cochlear haring
impairment high level is due to usual sensitivity.
COMPARISON AT EQUAL SL:
Many earlier studies (Luscher and Zwislocki 1949; Danes and
Nauton 1950) speculated that in cases of cochlear hearing loss due to abnormal
growth of loudness the intensity discrimination should be better than normal.
Clinical test for abnormal loudness growth were developed based upon this
premise (E.g. SISI, Jerger et al 1959). In this study it is shown that in
regions of cochlear hearing loss intensity discrimination at a given SPL can be
normal or near normal. This implies that Weber fraction for impaired ear at a
given SL can be normal or near normal, i.e. the DLI can be around 8 dB smaller
than those of normals at equal SLs. It supports that the hearing impaired use
large of spread if excitation at high SPLs than normal, a decreased or improved
DLI is not due to the loudness recruitment. The diagnostic test based on this
is not valid, but such tests are clinically useful still. The present study
also shows that Weber fraction elevated in regions in regions of hearing loss.
This can be also explained based upon spread of excitation because in case of
increased Weber fraction recruitment is present but DLI is poor. So, elevated
DLI do not imply an absence of recruitment.
INTENSITY DISCRIMINATION AT LOW LEVELS
It is well known that slope of rate versus level function of
normal auditory nerve fibers increases as the frequency of the stimulating tone
decrease below the characteristic frequency (Sachs and Abbas 1974, Harrison
1984). It is also shown that frequency dependency is largely eliminated in
cases of cochlear pathology and specifically that the rate versus level
function for HF tones is considerably steeper than normal (Harrison 1989).
The steeper rate Vs level functions seen in cochlear
pathology also suggest the possibility that Weber fractions near detection
threshold might be unusually small i.e. a smaller intensity change is necessary
to produce a given change in rate. But the relationship between intensity
discrimination and loudness is highly uncertain.
The figure compares fractions obtaining high pass noise for
listeners with flat and high frequency hearing loss (open squares) with the
mean Weber fractions for normal hearing listeners in quiet (solid lines). Weber
fractions obtained up to 25 dB SL are shown. This data indicates smaller Weber
fractions for cochlear impaired listeners. The average difference for levels
below 20 dB SL is 2.3 dB. For the high frequency loss listeners at frequencies
for which the loss is substantial, the Weber fractions are smaller than normal.
The results of this comparison are consistent with
expectations based on steeper rate versus level functions in regions of
cochlear loss. There are several aspects which prevent strong conclusion from
this comparison because we cannot be sure that high pass noise restricts
information to a region comparable to that for normal at low levels. Thus the
smaller Weber fractions may reflect incomplete elimination of the near miss.
Physiological data also shows Weber fractions are much smaller than those from
normal. For levels below 20 dB SL the corresponding level differences are 2.3
dB and 1.5 dB respectively. That is 2.3 dB increase for the normal should
produce the same change in rate that a 1.5 dB change produces in the cochlear
impaired listeners. For this to be true the ratio of the slope of the rates Vs
level function would be 2.3/1.5=1.5 a value considerably less than the ratio of
approximately 5 indicated by the auditory nerve data (Harrison 1981). Finally
the fact that the rate Vs level functions are steeper regions of pathology does
not in itself imply that the Weber fractions should be normal. Unfortunately,
the available data do not permit assessment of this possibility.
Summary:
Cochlear hearing loss – Weber fraction may be normal, if it
is normal, with high pass noise it gets elevated, suggesting spread of
excitation. When the Weber fraction is elevated, no further elevation in
threshold with the high pass noise suggesting inability to use spread of
excitation.
1.
In
the regions of loss, the Weber fraction may be with normal range, but the near
miss may no be evident in the Weber fraction with the high pass noise, suggest
an inability to use spread of excitation.
2.
At
a given SL, the Weber fraction for the frequencies in regions of cochlear loss
may be considerably better than normal. In general this simply reflects the use
of spread of excitation.
3.
At
low SLs in high pass noise where excitation spread is limited the Weber
fraction for frequencies in regions of cochlear loss are slightly better than
normal.
Mary Florentine et al (1993) studied systematic measurements
of intensity resolutions for pulsed tones as a function of levels in listeners
with SN hearing loss. Particular attention was given to the test frequency
relative to the configuration of the hearing loss, one listener with vestibular
schwanoma and 6 listeners with normal hearing. Measurements were also made in
normal ears presented with the masking noise separately shaped to produce
audiograms similar to those of cochlear impaired listeners. For unilateral
impairments, tests were made at same frequencies in the normal and impaired
ears. For bilateral sloping impairments tests were made at different
frequencies in the same ear. The normal listeners showed results similar to
other data in the literature. The listeners with vestibular schwanoma showed
greatly decreased intensity resolution except at few levels.
For listeners with recruiting SN impairments the results are
discussed according to the configuration of the impairment and are compared
across at equal SPL, equal SL and equal loudness level .Listeners with
increasing hearing losses at frequencies above the test frequency generally
showed impaired resolution, especially at high levels and less deviation from
the Weber’s law than the normal listeners. Listeners with decreasing hearing
loss as frequencies above the test frequency showed nearly normal intensity
resolution functions. Where as these trends are generally present, there are
large differences among individuals. Results obtained from normal listeners who
were tested in the presence of masking noise indicate that elevated thresholds
and reduced dynamic range account for some but not all of the effects SN
impairment on intensity resolution.
INTENSITY DISCRIMINATION WITH COCHLEAR IMPLANTS
Intensity discrimination data from human implant patients
have been difficult to interpret owing to a number of factors including the
scarcity of data, the lack of independent indices of how well the subjects can
perform an intensity discrimination task or how much very might be expected to
improve with practice and the lack of adequate stimulus specification.
One of the more extensive tests of intensity discrimination
in patients with cochlear implant was conducted by Bilger 1977 who tested 12
patients using acoustic stimuli delivered to the subject’s portable stimulator.
Intensity discrimination was tested for 3 narrow band noise stimuli at various
SL s ranging from 7 to 25 dB SL. DL ranged from 0.66 dB to >12 dB, but
generally were 1.6 dB or smaller. In most of the cases they were smaller for
low frequency noise (centered at 250 or 500 Hz) than for higher frequency noise
(centered at 2 KHz). 3 subjects showed smaller difference limen for lower than
for higher intensities of stimulation. 5 subjects showed neither frequency nor
level dependence.
Intensity discrimination testing with known charges
delivered to the electrodes has been done on 3 patients with modiolar implants
(Simmons 1996, Mathews 1978, Walker 1978). A variety of intensities and
repetition rate of pulsatile stimulation were used to test these patients.
Intensity difference limens ranged from 0.16 to 8 dB averaging about 1.5 to 3
dB. The data are variable and there is no clear and consistent relation between
the difference limen and with the intensity or repetition rate.
Much lower values were obtained by Hochmair 1981 who
measured intensity difference limens in 5 patients with scala tympani implants
and observed values ranging from 0.07 to 0.34 dB averaging about 0.2 dB.
CLINICAL APPLICATION OF DIFFERENTIAL SENSITIVITY FOR
INTENSITY
The difference limen tests of recruitment are based on the
measurement of the rate of change of loudness as the intensity increases. The
rate of change with increase in intensity is greater in resulting than non-recruiting
ears. The change in intensity in dB which results in just-barely-noticeable
loudness change is termed the intensity difference limen for loudness.
Methods of measuring DLI:
Luscher-Zwislocki
Method (1948)
They used pure tones, presented at 40 dB SL and patients
were asked to indicate when amplitude modulation of steady state signal
resulted in pulsating sound. Those patients who could detect small intensity
change were assumed to have cochlear lesions. That is persons having a critical
percentage modulation of less than 80% were considered to have recruitment.
Limitations:
1.
Persons
with mild or non- steepy sloping audiometric configuration obtained critical
modulation percentage greater than 8% and some normal hearing persons
obtained less than 8%
2.
Individual
variability in judgment affected the reliability of the test.
Denes-Naunton Method ( 1950)
They developed a recruitment test based on the intensity DL
for loudness. In the test, two tones of the same frequency are presented to an
ear and the intensity of one of the tones is varied until a perception of a
just-noticeable change in loudness results. Test was conducted at 4 and 44 dB
SL.
The determination of recruitment was based on a relative
than absolute measure of the intensity DL for loudness .If the intensity DL
increased or remained the same as the SL increased, recruitment was assumed to
be present. If the intensity DL decreased as the SL increased as the SL
increased, recruitment was assumed to be absent. In case of cochlear hearing
loss not much difference at 44 dB SL and 4 dB SL, where as in normal at 44 dB
SL -1 dB increment enough, at 3-4 dB SL increment is needed to detect the
change. Jerger (1952) modified the Luscher-Zwislock test. He used presentation
level at 15 dB SL rather than 40 dB SL, since the literature shows that the
intensity DL was most affected between 10 and 30 dB SL. He found
that this showed good differentiation between recruiting and non recruiting
ears.
He found that patient with reduced intensity DLs had non
conductive hearing impairments; enlarged intensity DLs had functional hearing
loss, normal intensity DLs had conductive or presbycusis.
Luscher (1951) modified the intensity DL test to employ a
presentation level of 80 dB HL. He employed in person with hearing loss
magnitude exceeding 60 dB HL, the rationale underlying this modification two
folds.Recruitment for hearing loss was present at this level is small in normal
hearing person, indicating that the task of masking loudness judgments was
simplified. Complete recruitment was assumed to be present if hearing impaired
person obtains an intensity DL of 4-6% at this presentation level
DIFFERENTIAL SENSITIVITY FOR FREQUENCY
Frequency discrimination in the hearing system is the
ability to distinguish two non simultaneous sounds which differ on frequency
but otherwise equal. It is important for many purposes to determine accurately
the minimum change in the frequency of a tone which can be detected by the ear.
It can be expressed in absolute or relative terms.
Absolute Method:
It is measured as the difference between the two frequencies
in which the difference is perceived (unit= Hz)
Relative Method:
This is a method where the relative difference is obtained
by dividing the absolute DL by the value of frequency at which it is being
measured. E.g. suppose it is necessary to change a 1000 Hz tone (f) by a 2.6 Hz
(f) in order to just detect the frequency difference then the absolute
frequency DL is 2.6 Hz and the relative difference ∆f/f=2.6/1000=0.0026 Hz.
There are 3 ways of measuring frequency discrimination
1. Difference
Limen for Frequency (DLF)
It involves the discrimination of successive steady tones
with slightly different frequency. This requires both use of short term memory
for pitch and an ability to determine the direction of frequency change (Harris
1952; Jestead et al 1975).
2. Frequency
Modulation Difference Limen (FMDL)
It uses tones that are frequency modulated at low rate
(typically 2 to 4 Hz). Here the subject can detect any change regardless of
direction within the modulated stimulus. When this method is used, the
frequency changes between f-∆f and f+∆f. Thus, the value for the total
variation in frequency is 2f.
3. Difference
Limen for Change (DLC)
Here the task is to identify the interval in which the tones
are different in frequency i.e. the subject has to detect any change regardless
of the direction of the change in frequency.
FACTORS AFFECTING DLF:
Frequency discrimination as a function of frequency and test
stimuli:
The early work of differential frequency sensitivity was
plugged by Shower and Biddulph (1931). They used frequency modulated tones as
the stimuli. A rest tone was varied continuously in frequency at a rate of
2/sec. The subject’s task was to detect the presence of a modulated as opposed
to a steady tone. The DL was taken as the smallest difference in frequency that
produced a perceptible modulation of original tone. The study included wide
range of frequencies from 62 Hz to 11700 Hz and 5 to 80 dBSL. Result showed
FMDL’s tend to vary less with frequency. However, they observed DL becomes
larger as frequency increases and DL becomes smaller as SL increases.
Wier et al (1961), did a study using pulsed tone from 200 Hz
to 8 KHz at 5 to 80 dBSL. The results showed DL becomes larger as frequency
increases and DL becomes smaller as SL increases. The best value of DL occur at
low frequency presented at about 40 dBSL or
more.
Moore and Sek (1994) measured frequency discrimination for a
wide range of center frequency (0.25 to 8 KHz) using DLF, DLC and FMDL’s. The
result showed for frequencies up to 2 KHz, DLF’s and DLC’s were small (less
than 0.6% of center frequency) and were similar to one another. For frequencies
of 4 KHz and above both DLF and DLC increased markedly but the increment was
greater for DLF’s which indicates the worsening of performance at high
frequencies is greater when subjects are required to indicate the direction of
the frequency change than when they just have to detect any change. FMDL’s when
expressed relative to the carrier frequency, varied much less with frequency
than DLF’s or DLC’s. At 2 KHz and below FMDL’s were larger than DLF’s or DLC’s.
Above 4 KHz, FMDL’s were smaller than DLF’s or DLC’s. At 2 KHz FMDL’s improved
with increasing modulating frequency. The pattern of result suggest that
mechanisms play role in frequency discrimination, one based on place of
excitation pattern (a place mechanism) and one based on phase locking in the
auditory nerve (temporal mechanism). The temporal mechanism only operates below
about 4 KHz and within this range it becomes DLF’s and DLC’s. The temporal
mechanism is probably sluggish and affects FMDL’s for very low modulation rates
.The place mechanism dominates for high frequencies and lower carrier frequencies
when stimuli are frequency modulated at high rate.
Frequency Discrimination as a function of frequency and
sensation level;
Wier and Green (1976) measured the frequency discrimination
for frequencies from 200 to 8000 Hz and for sensation levels from 5 to 80 dB
using pulsed sinusoids as stimuli in an adaptive two interval forced choice
procedure. The result showed frequency discrimination to be dependent on both
frequency and sensation level. The Weber fraction ∆f/f is non monotonic
function of frequency between 1000 and 2000 Hz for all sensation levels.
There is orderly dependence of frequency discrimination on
sensation levels for pulsed sinusoids. The linear functions are steepest at
high sensation levels and decreased as sensation level is decreased. The effect
of sensation level is greatest at low frequency and decreased at high
frequencies. The result is in agreement with the hypothesis that high frequency
information is entirely depended on place of excitation.
Temporal effect in the frequency discrimination:
Frequency discrimination for tones varies with tonal
duration. The DLF for signals with duration of more than 150 msec is fairly
constant. For less than 150 msec, there is progressive increase in the size of
the DLF. (Turball 1944; Chistovichs1960; Cardoz 1962). This effect seems to due
to physical characteristics of short tones. That is the band width of the
signal increases as its duration decreases. The resulting uncertainty of the
signal is manifested as an increase in the size of DLF. Both normal and hearing
impaired subjects show this inverse relationship between signal duration and
size of DLF.
Geugel (1973) hypothised one cause for high correlation as
larger DLF’s in SN loss cases than normal hearing subjects indicates frequency
uncertainty in the perception of pure tones. Hence, long duration signals will
not sound like pure tones instead they sound rough, buzzing or noisy. The
degree of uncertainty varies among hearing impaired subjects depending on their
nature of impairment. Reducing the signal duration to 50 msec, and further
increases frequency uncertainty
Frequency Discrimination and Speech perception:
Slight correlations have been reported between word
recognition and frequency DLs (Di Carlo 1962; Ross et al 1965), consistent with
the findings of the study by Tyler et al (1982). In this study it is indicated
that hearing impaired listeners had only a small loss of speech understanding
in quiet. The result of this study also indicates that the week relationship of
speech must certainly depend on numerous underlying properties of frequency,
intensity, and temporal coding and it is therefore not surprising that any
single factor would not demonstrate high correlation with word identification.
Frequency discrimination in Hearing Impaired Listeners:
It has been shown that frequency resolution (Pick et al
1977; Florentine et al 1980; Tyler et al 1980) and frequency discrimination of
constant tone can be altered in listeners with cochlear hearing loss. Only
limited data are available on the frequency discrimination of tones changing in
frequency in the hearing impaired.
Frequency resolution is the ability to resolve frequency
components of stimulus. This could be important in analyzing speech sounds in
determining the number and frequency of formants. Frequency discrimination is
the ability to discriminate successively presented stimuli that differ in their
frequency content. This could be important in determining if the fundamental
pitch of one speech sounds is higher or lower compared to some previous sound.
The frequency content of speech is dynamic and frequency resolution and
discrimination must be performed on formants that are changing in frequency.
Theories of frequency discrimination:
Two mechanisms involved in detecting the DL.
· The
subject may detect shifts in the place of maximum excitation in the cochlear
place theory.
· Temporal
information- frequency theory- the subject discriminates the two tones by using
some intervals between the neural firings
Place Theory:
Zwicker (1970) has attempted to account for frequency
discrimination in terms of changes in the excitation pattern evoked by the
stimulus when the frequency altered. Generally regarded as place model, even
though the excitation level might be coded partly in the timing of neural
impulses. According to him a change in frequency will be detected whenever the
excitation level at some point, the pattern changes by more than a certain
threshold value. He suggested that this value was about 1 dB. The change in the
excitation level is always greatest on the steeply sloping low frequency side
of the excitation pattern. This model predicts that the frequency DL at any
given frequency should be constant fraction of critical band at that frequency.
FMDL’s do confirm well to the
prediction of the model. But DLF’s vary more with frequency than predicted by
the model. At low frequencies DLF’s are smaller than predicted, while at high
frequency they are slightly larger than predicted (Moore and Glasberg, 1986)
Herning (1966) has pointed out a problem with the
measurement of frequency DL’s at high frequencies. The frequency change may be
accompanied by correlate loudness changes. These loudness changes may provide
observers with usable cues in detection of frequency changes.
In summary, Zwicker’s model predicts that:
1. Frequency
DLs should vary with frequency and random variations in level should markedly
increase frequency DLs
2. DLF
vary with frequency than the critical band and the effect of randomizing level
is smaller than predicted except at high frequencies.
3. FMDL’s
data are generally consistent with Zwicker’s model.
4. The
results are consistent with the idea that DLF’s are determined by temporal
information (phase locking for frequencies up to about 4 to 5 KHz and by place
information above that). The precision of phase locking decreases with
increasing frequency above 1 to 2 KHz and it is completely absent above about 5
KHz.
Temporal/Frequency Theory:
Rutherford (1886) each cell in cochlea responded to every
tone and that frequency information was carried only the frequency of the
neural impulses.
DLF- Clinical application:
Differential sensitivity measure can be used in the
phenomena of diplacusis binauralis. If we present the tone of constant
frequency to one ear and ask him to adjust the frequency of the tone presented
to the opposite ear until the two tones sound equal in pitch. If he is a normal
listener, he will set the second tone to the frequency of the first plus or
minus the associated DL. A listener with diplacusis will set the frequency of
the 2nd tone by more than DL i.e. they tend to hear two widely
separated pitches equal. In short diplacusis phenomena is demonstrated in a
listener with a hearing loss and seems to confirm a recruiting type of deafness
(Hirsh 1952)
Neil and Elliot (1970) demonstrated the effect of DLF on
ears with adaptation. There are changes reported in the quality of auditory
experience produced by an adapting stimulus which increase with duration. These
have an effect on DLF causing shift in pitch. They obtained data under normal
and adapted conditions at two frequencies (250 Hz, 1 KHz), two intensities (40
dB SL and 60 dB SL) and with two mode of presentation.
Berndt (1967) have a description of the effect of DLF after
exposure to noise. Measures of threshold and DLF were obtained at 1, 2, and 4
KHz before and after exposure to WBN. Stimuli were presented at 10 and 40 dB SL.
No differences between pre and post exposure individual were obtained at 40 dB
SL or greater at any frequency. However, at low SL’s a differential effect on
JND owing to noise exposure was seen. At 2 KHz 10% impairment in the JND
existed in the later stage of recovery. At 1 KHz‘s post exposure JND’s were
about 40% greater than pre exposure values. It would be interesting to examine
the effect of auditory fatigue upon such measures as discrimination. It might
provide useful information concerning the fatigue process and their
manifestation and quite possibly may also increase our understanding of the
mechanism of the intensity frequency discrimination processes as well.
Meweman (1954) conducted a study of monaural frequency
discrimination in cases with Menier’s disease. He showed that the groups mean
values for DLF in subject with Menier’s disease were substantially greater than
values for normal especially at the higher frequencies.
Test Based on DLF:
Cambell (1970) developed a test called Frequency Increment
Sensitivity Test (FIST) which is audiometric test using incremental variation
in the presentations and scoring method analogous to the SISI test.
A range of frequency increment and sensation levels are used
for test. Here, a continues tone was used in which frequency will be changed or
in increment of frequency will be employed every 5 sec. this frequency
variation was 200 msec in duration. The difference between the maximum
frequency during the increment and the base frequency was the measure of frequency
size which was represented as the percentage of the base frequency. If the
subject gets score less than 40% indicates cochlear pathology. If it is higher
either it can be cochlear pathology or normal hearing.
CONCLUSION:
- Ø There are many differences in studies of intensity and frequency discriminations.
- Ø The data for intensity discrimination of pulse sinusoids at various frequencies and sensation levels are different than detection of amplitude modulation.
- Ø Intensity discrimination dependent on SL as well as test frequency. As SL increases, DLI improves; there is near miss to Weber law, DLI is almost constant till 8 KHz, and becomes poor above this frequency.
- Ø Both normal hearing and cochlear hearing impaired subject’s exhibits near miss to Weber’s Law.
- Ø Both high frequency and low frequency side of the excitation pattern is necessary for DLI, but high frequency side of the excitation pattern is more important than low frequency.
- Ø At a given SL, the Weber fraction for frequencies in regions of cochlear loss may be considerably better than normal.
- Ø The frequency discrimination is dependent on both signal intensity and frequency; changes in signal intensity have a greater effect on at low frequencies than at high frequencies.
- Ø At low frequency, frequency discrimination is primarily determined by the place mechanism.
- Ø Frequency resolution and frequency discrimination of constant tones is altered in listeners with cochlear hearing impairment. Frequency discrimination depends primarily on temporal coding and frequency resolution on place coding.
- Ø Frequency discrimination, particularly by transitions, can be drastically reduced in some hearing impaired listeners. This is not easily predicted on the basis of pure tone thresholds.
- Ø Studies report slight correlation between SDS and DLF
- In general, intensity and frequency discrimination are dependent on SL and test frequencies. Both aspects are affected in cochlear hearing impaired listeners. The results vary depending on the type and pattern of hearing loss. The DL test of recruitment is based on the measurement of the rate of change in loudness as intensity increases. This rate of change is usually greater in recruiting ears. Clinically these measures can be used to differentiate between cochlear and retro cochlear hearing impaired ears.

Comments
Post a Comment