INTRODUCTION TO ELECTROCOCHLEOGRAPHY (ECochG)
- HISTORICAL PERSPECTIVE
In contrast to the rather confusing and varied terminology used to describe other AERs, there is
relative consistency in referring to this response. Very early papers refer to ”cochlear potentials” and
some researchers use the terms “cochlear action potentials” or “cochlear microphonic” potentials.
However, most authors and clinicians adhere to the conventional term “electrocochleography” or
“electrocochleogram,” as abbreviated ECochG or ECoG. The former abbreviation is possibly more
precise, since ECoG may also refer to “electrocorticogram,” an EEG-type recording. Along the same
line, the abbreviation “ECG” is not advised because it is also an abbreviation of a diagnostic
measure of heart function, the “electrocardiogram.” In this book, therefore, the term
electrocochleography, abbreviated ECochG, is used exclusively.
Typical ECochG waveforms were shown in Figure 1.1. The response, arising from the cochlea and
eighth (auditory) cranial nerve, occurs within the first 2 or 3 milliseconds after an abrupt stimulus.
The first component observed, under certain measurement conditions, is referred to as the cochlear
microphonic (CM). The CM is an alternating electrical potential arising from outer hair cells in the
cochlea. With a single polarity stimulus, either rarefaction or condensation, the CM appears as a
waveform with a series of repeated upward and then downward peaks.
An example of CM was also shown in the bottom ECochG waveform in Figure 1.1. The CM
component may partially obscure later components in the ECochG waveform because it continues as
long as the stimulus is presented. Use of an alternating polarity stimulus effectively reduces the CM
component. The upward-going bumps to the positive voltage polarity stimuli are averaged in with the
downward-going bumps to the negative voltage polarity stimuli. The CM is largely cancelled out
when ECochG is evoked with alternating polarity stimuli.
The next two ECochG components are the summating potential (SP) and the action potential (AP).
The SP usually appears as a hump or ledge on the beginning slope of the AP or as a distinct wave
with a peak preceding the AP. The SP peak may be in the same direction as the AP or in the opposite
direction, depending on measurement conditions. The location of the non-inverting and inverting
recording electrodes is an important factoring in determining whether the AP, and sometimes the SP,
is positive or negative. Another term for the AP is the N1 when it’s the first negative-going peak in the
ECochG waveform. In this book, the AP component is plotted upward in a positive direction in order
to be consistent with other auditory evoked responses, and the term N1 is not used. The AP is almost
always much larger in amplitude than the SP. Latency of the ECochG AP component is about 1.5-ms
when measured with a high intensity click stimulus in a normal hearing person. It’s important to
remember that the AP component of ECochG is the same as ABR Wave I.
The SP arises from the cochlea, with major contribution from the inner hair cells. The AP is generated
by fibers in the distal or cochlear end of the auditory (eighth cranial) nerve. The AP is actually the
compound or combined action potentials (CAP) of many nerve fibers. Technically speaking, the AP
component of ECochG is not really a cochlea response, although the auditory nerve fibers are within
the bony portion of the cochlea and only a synapse separates them from the inner hair cells of the
cochlea. A second major peak is usually observed following the AP and is sometimes described in
reference to the ECochG waveform. The label N2, implying the second negative peak, is often used
as a label for this peak. However, the label is not really appropriate if the component is positive and
upward going when displayed. The N2 is equivalent to the wave II component of the auditory
brainstem response (ABR).
- Discovery and Early Developments
The first paper on ECochG was also the first publication on auditory evoked responses in general. In
1930, Ernest Glen Wever and Charles W. Bray of Princeton University published a two-paragraph
summary of observations on auditory physiology investigations in cats. Figure 1 shows a
photograph of Dr. Wever.

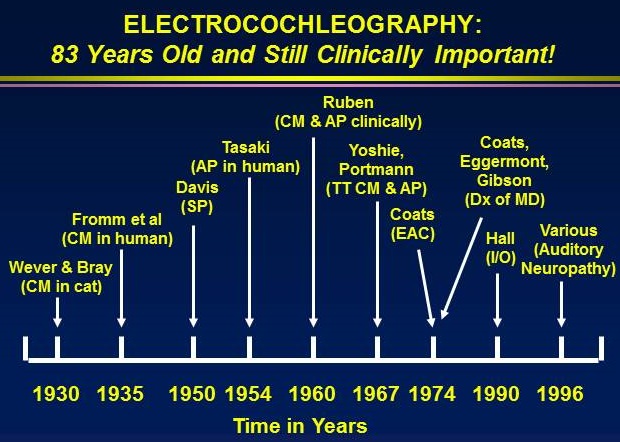
Some of the important developments in the interesting history of ECochG are highlighted in the
following listing:
- 1930: Wever and Bray discover the cochlear microphonic (CM) in cat
- 1935: Fromm and colleagues record the CM from the round window in humans with tympanic membrane perforations
- 1935: Davis and Derbyshire recording the action potential (AP) from the round window and analyze data with superimposition of recorded waveforms
- 1941: Perlman and Case record CM from the round window via perforations in humans an they photograph the recordings
- 1947: Lempert and colleagues record CM from the round window through perforations i humans
- 1950: Davis identifies the summating potential (SP) in animal
- 1953: Tasaki records AP from single 8th cranial nerve fibers in animal
- 1959: Ruben records CM from human with hearing impairment
- 1960: Ruben records AP from round window in humans with ear pathology
- 1963: Ruben records AP directly from 8th cranial nerve in children
- 1965: Kiang publishes classic monograph of discharge patterns of auditory nerve
- 1967: Yoshie records CM from promontory using trans-tympanic (TT) needle
- 1967: Yoshie non-invasively records AP in humans with ear canal electrode
- 1967: Portmann and colleagues record AP with promontory TT needle technique
- 1967: Sohmer & Feinmesser record AP in humans with earlobe electrode
- 1969: Aran and colleagues record AP in children with TT electrode technique
- 1972: Cullen, Berlin and colleagues record AP in humans with tympanic membrane electrode
- 1974: Coats records CM, SP, and AP in humans with ear canal electrode
- 1974: Eggermont describes ECochG findings in Meniere’s disease
- 1974: Eggermont describes frequency specific ECochG response with ipsilateral masking
- 1974: Gibson and colleagues further describe ECochG in Meniere’s disease
- 1977: Arlinger describes ECochG evoked with bone conduction stimulation
- 1985: Yanz and Dodds describe improved ear canal electrode (TIPtrode)
- 1989: Schwaber and Hall describe simplified TT electrode technique
- 1992: Hall described advantages of a simplified TT electrode technique in intra-operative monitoring
- 2007: Gibson applies ECochG in diagnosis of auditory neuropathy spectrum disorder (ANSD)
- ANATOMY AND PHYSIOLOGY
As already noted, ECochG consists of two sound-evoked cochlear responses plus the compound
eighth (auditory) cranial nerve action potential. The cochlea and eighth nerve are enclosed within the
temporal bone, the hardest bone in the body. Important structures within the region, including the inner
and outer hair cells in the cochlea and the distal fibers of the auditory nerve are shown in a familiar
cross-section drawing of the inner ear (Figure 2.2). ECochG potentials are the cochlear microphonic
(CM) and summating potential (SP). The CM is an alternating current (AC) potential that follows the
waveform of the stimulus and the vibrations of the basilar membrane. A pure tone stimulus, for
example, produces a CM that appears as a sine wave of the same frequency. In the initial classic
Wever & Bray (1930) experiment, speech was presented to the experimental animal while an
electrode was placed within the auditory nerve. The resulting electrical activity when converted back
to sound and amplified was perceived as speech. The CM begins almost instantly with the stimulus,
that is, it has no latency.
The CM arises mainly from outer hair cells in the normal cochlea (Dallos, 1973; Sellick & Russell,
1980). As recorded clinically from outside the cochlea with an electrode on the promontory or from
an electrode in the external ear canal, the CM reflects outer hair cell activity in the basal portion of
the basilar membrane (Aran & Charlet de Sauvage, 1976; Hoke, 1976; Sohmer, Kinarti, & Gafni,
1980). Mechanisms underlying CM production include velocity or acceleration of hair cell
movement, displacement of the basilar membrane, and receptor potential activity generated at the
apex of outer hair cells secondary to bending of the stereocilia. Single polarity rarefaction or
condensation stimuli are most effective for eliciting the CM. Stimulating the ear with alternating
polarities effectively cancels out the CM.

Figure 1. Origins of the ECochG components including the cochlear microphonic (blue arrow), the summating potential (red arrow), and the compound action potential (green arrow).
The SP is a direct current (DC) potential recorded following presentation of a continuous tone or a
transient acoustic stimulus, such as a click or a tone burst. It is a reflection of nonlinear properties of
the cochlea. The SP may be viewed as a shift in the baseline of an ECochG recording, usually
occurring in the same direction and just prior to the compound action potential (AP) of the eighth
nerve. The precise source of the SP within the cochlea has been questioned since its discovery in the
early 1950s. The origin of the SP has been attributed to distortion products associated with
irregularities in basilar membrane and hair cell displacement, subsequent generation of electrical
current (Eldredge, 1974; Whitfield & Ross, 1965), and to both inner and outer hair cell activity
(Dallos, 1973). Durrant and colleagues concluded that the SP component arises mostly from inner
hair cells (Durrant, Wang, Ding, & Salvi, 1998). These authors showed that the medication
carboplatin administered to chinchilla caused severe damage to inner hair cells and eliminated most
of the DC potential that corresponds to the SP. Carboplatin is a potentially ototoxic drug used
therapeutically in patients with certain types of cancer. It’s possible that outer hair cells may
contribute to generation of the SP component at low intensity levels (Wuyts et al., 2001). The SP,
unlike the AP, is clearly observed even with extremely rapid stimulation. Also, the SP component is
relatively more prominent when recorded with a high-frequency tone burst stimulus than with other
types of stimuli. Tone burst signals are sometimes used for generation of ECochG components,
especially in diagnosis of Ménière's disease and endolymphatic hydrops.
The AP component of the ECochG waveform represents activity within the eighth (auditory) cranial
nerve. It’s more accurately referred to as the compound action potential because in clinical ECochG
measurement the response arises from hundreds if not thousands of auditory nerve fibers. To reiterate,
the AP component is the same as component as ABR wave I. With an electrode array sometimes used
in ECochG measurement, the AP is recorded with negative (N) electrical polarity and is plotted with
the peak downward. Since the AP reflects synchronous firing of many eighth nerve fibers, amplitude
is largest for transient stimuli such as click stimuli that have abrupt, rapid rise times and a broad
spectrum of frequencies. AP amplitude increases and latency decreases with increased stimulus
intensity. The intensity-related increase in amplitude is due to an increase in the number of eighth
nerve fibers contributing to the response. That is, there is more nerve activity summating at essentially the same time. Other important factors affecting AP latency and amplitude changes as a function of stimulus intensity include synaptic properties of the hair cells—for example the rate of excitatory post-synaptic potentials, or EPSPs (e.g., Møller, 1983; Pickles, 1988). The intensity-related decrease in AP latency is thought to reflect a more basal origin of cochlear activity as the basilar membrane traveling wave for higher intensities extends in that direction.
A second wave, labeled N2 if plotted downward or P2 if plotted with positive upward, is sometimes
noted in discussions of ECochG. There are two apparently conflicting theories on the origin of N2.
Based on study of derived frequency specific ECochG recordings, the AP (N1) reflects eighth nerve
firing due to activity in the basal high-frequency portion of the cochlea, whereas N2 reflects eighth
nerve firing due to activity in more apical lower frequency regions of the cochlea (Eggermont, 1976b;
Elberling, 1976). Stimulus intensity is an important factor in these theories on the AP (N1) versus N2
generators. High-intensity stimuli produce mostly activity in the basal first turn region of the cochlea,
whereas low-intensity stimuli may also activate lower frequency and second turn portions of the
cochlea (Yoshie, 1976). It is generally agreed that AP (N1) component amplitude decreases directly
with intensity. However, according to some authors N2 component amplitude increases as stimulus
intensity decreases and at very low intensities only the N2 component is present (Gibson, 1978).
Latencies for both components increase as intensity decreases. For click stimuli at high intensity
levels, at least, the N2 component is probably equivalent to ABR wave II.
The velocity of the traveling wave on the basilar membrane is considerably faster in the basal turn
than in the apical turn. For example, velocity is estimated at 20 meters/sec for a frequency of 10,000
Hz and 2 meters/sec at 500 Hz. In the apical region of the cochlea, traveling wave velocity is
inadequate to produce synchronous firing of associated eighth nerve afferent fibers. The traveling
wave requires approximately 5-ms for transit from the 10,000 Hz region to the 500 Hz region of the
cochlea (Békèsy, 1960; Borg, 1981a; Elberling, 1976; Özdamar & Dallos, 1976; Parker & Thornton,
1978; Zwislocki, 1975). Manipulation of a stimulus parameter that results in more basal cochlear
activation, such as increasing the frequency or intensity, decreases the latency of the AP component.
For tone burst stimuli, the decrease in latency with increased intensity is in animal experiments
(Møller, 1983) most pronounced for relatively low frequencies (e.g., 2000 Hz) and minimal for very
high frequencies (e.g., 20,000 Hz).
What is ECoChG:
Electrochocleography (ECochG) is the technique
of recording the electrical responses of the cochlea. The clinical
application of ECOCHG however (a) usually is confined to the stimulus related
cochlear potentials, and (b) also includes measurement of the whole nerve or
compound action potential of the auditory nerve.
I .ECochG COMPONENTS
Cochlear
micro phonic (CM)
Summating
potential (SP)
Compound
Action potential(AP)
The
popularity of the ECochG as a clinical tool did not emerge
until 1970’s. CM was discovered in the cat by Wever and
Bray (1930). The SP was described in animals in 1950 (Davis et al
1950) and received little attention in humans (Eggerment 1976). The
first recordings of human auditory nerve CAPs are credited to Ruben and his
colleagues (1960).
Clinical Applications
1. Diagnosis / assessment
or monitoring of Meniere’s disease (MD) /end lymphatic hydrops (ELH) and the
assessment/monitoring of treatment strategies for these disorders.
2. Enhancement of Wave I
of the ABTR in the presence of hearing loss or less than optimal recording
conditions.
3. Measurement and
monitoring of cochlea and auditory nerve function during surgical procedure
involving the auditory periphery.
Cochlear micro phonic:- (CM)
It
is an alternating current (AC) voltage that reflects the instantaneous
displacement of the basilar membrane along some distance defined by the effective
site of the recording within the cochlea, the method of recording and the
stimulus conditions.
The
popularity of CM in the laboratory derives from
Its link
to cochlear transduction
Its
sensitivity to the health of the cochlear partition
The
relative ease with which it can be recorded within the fluid spaces of the
cochlea(using intra cochlear electrode and in the round window)
Reductions
in CM magnitude have been reported for various disorders such as
MD & vestibular schwannomas (Gibson & Beagleus 1976)
CM mimics
the stimulus, so it is difficult to separate it from stimulus artifact.
CM is
sensitive to changes in middle ear transmission characteristics.
CM
follows polarity of click stimulus, summing or averaging the response to
stimuli of alternating polarity will generally cancel out the CM (Yoshie 81)
Summating potential (SP):
It
is a complex response made up of several components. It is direct
current shift receptor potential reflecting cochlear electrical activity in
response to acoustic stimulation. It follows envelops of the
stimulus and clearly influenced by the stimulus duration but not markedly
influenced by stimulus frequency. SP is stimulus related and generated by the
hair cells of the organ of corti.
The
SP manifests itself as a shift in the CM baseline, the direction of which is
dictated by an interactive effect between stimulus parameters (frequency and
intensity) and the location of recording electrode. When recorded
Extra tympanic means the SP is often seen as a downward deflection that
persists for the duration of the acoustic stimulus. SP like potentials are
observable inside the hair cells and known to be quiet sensitive to mechanical
and electrical biasing (Durrent and Dollos (1972)
Its
role in hearing function remains unclear .However as DC responses to AC
stimuli; at least some of the components of the SP represent inherent non
linearties associated with the transduction process in the cochlea. (Dallos et
al 1972). This non linear characteristic has made the SP useful for monitoring
certain clinical condition. Enlarged SP is seen in patients with MD/ELH.
(Schmidt et al 1974)
Compound Action potential:-
It
is a summed response of numerous auditory nerve fibers firing
synchronously. AP is most often generated by click stimuli
clinically. It is possible to obtain highly frequency specific
information using abrupt onset tone bursts of different frequencies and to
record response with a promontory electrode;
It
is an AC voltage and the AP waveforms are characterized by a series of brief
predominantly negative peaks representing the distribution of underlying neural
firings. The first peak is referred to us N1 ( waveI of ABR).For
clinical purpose, the most useful features of the AP relate to its magnitude
and latency. The most popular application or the AP involves comparing its
magnitude to that of SP in patients suspected of having MD/ELH. (SP
/AP magnitude ratio). Enlarged magnitude ratio to click stimulus is
a positive finding for ELH. (Eggermont 1976, Coats 1981)
TEST PARAMETERS
- Introduction
For more than 80 years, ECochG has been investigated clinically with click and frequency-specific
stimulation (Fromm, Nylen, & Zotterman, 1935; Perlman & Case, 1941). Each of the major ECochG
components … CM, SP, and AP… is differentially affected by stimulus type and frequency. The CM
waveform closely resembles the waveform of a pure-tone stimulus of a single polarity and, therefore,
is altered distinctly and predictably by frequency. As demonstrated in the earliest experiments studies
of Wever and Bray (1930a,b), the CM can be recorded from anywhere within the cochlea or on the
surface of the cochlea. With clinical application of ECochG, it’s important to keep in mind the longrecognized principle that CM arises only from the basal turn of the cochlea and primarily from outer hair cells, at least as typically recorded in the time domain with any stimulus frequency using an electrode located outside of the cochlea, such as from the promontory or external ear canal (Dallos,1973; Hoke, 1976; Sohmer, Kinarti, & Gafni, 1980). There is some clinical evidence that analysis of frequency and phase components of the CM might permit detection and localization of more apical site of hair cell activity in normal and pathologic ears (Euler & Kiessling, 1983). Summing or averaging the response to stimuli of alternating rarefaction and condensation polarity generally cancels out the CM because the CM follows polarity of a click stimulus (Yoshie, 1971). This process is specifically employed clinically to eliminate interference of CM in recording the SP and AP. As noted already, the SP is a DC receptor potential reflecting cochlear electrical activity in response to acoustic stimulation (Tasaki et al., 1954). The SP follows the envelope of the stimulus. The SP is, therefore, clearly influenced by stimulus duration but not markedly influenced by stimulus frequency.
In clinical applications of ECochG, the AP component is most often generated with click stimuli, yet
it is possible to obtain highly frequency-specific information on cochlear function. There are
numerous reviews and original research papers on this topic (Eggermont et al., 1974; Mouney,
Cullen, Gondra, & Berlin, 1976; Ruben et al., 1976; Teas, Eldridge, & Davis, 1962; Terkildsen,
Osterhammel, & Huis in’t Veld, 1975). Perhaps the most effective and relatively simple technique for
frequency-specific ECochG measurement is to evoke the response with tone-burst stimuli of different
frequencies and to record the response with a promontory electrode (Aran, 1971; Eggermont, 1974;
Eggermont et al., 1974; Naunton & Zerlin, 1976; Odenthal & Eggermont, 1974; Yoshie, 1971). Of
course, the onset of the signal must be abrupt with a rise time that is usually less than about 5-ms.
- Electrode Type and Location
The electrode site influences or interacts
with other acquisition parameters. (e.g. amplification, signal
averaging) as well as stimulus parameters (e.g. intensity rate and polarity)
.This can be classified broadly as Extra Tympanic and Trans Tympanic
EcochG.
1) Trans tympanic electrodes (TT)
TT
placement of a needle on the promontory yields optimal ECOCHG
recordings. This “near field” situation produces large components,
requiring relatively little signal averaging. The amplitude of the
ECOCHG components recorded with the TT electrode technique is on the order of
15 to 25micro volt and 10 times to 40 times larger than ear canal electrode
placements (Schwaber & Hall 1990).The use of steel electrode that is coated
with Teflon for insulation ,except for the tip is usually recommended(Wuyts et
al 1997) TT electrode approach also confirms enhanced reliability, confidence
in waveform analysis and, for the diagnosis of Meniere’s disease, optimal test
performance.(sensitivity and specificity).
The major limitations of TT ECOCHG relate to
its invasiveness and assistance of physician and are therefore limited to
medical setting. Penetrating the tympanic membarane with needle is painful even
when local anesthetics are used (Both Beyond et al (1998).Haapaniemi et al 2000
,showed no report of discomfort with TT electrode placement.
2) Tympanic membrane electrodes:- This
electrode was designed to maximize response amplitudes while minimizing
clinical preparation cleansing and insertion requirements.The electrode
consists of a small gauge silver wire enclosed within a flexible silastic tube
and connected to a soft foam sponge at the tip, which will be filled with
conductive gel. The tube is fed down the ear canal until the electrode at the
tip actually makes contact with the TM. This electrode is commercially
available from bio-logic system. Should inspect the ear canal before insertion
of TM electrode. Any discomfort to the patients should be monitered.
3) TIP Trode:-
Ear canal electrode designs were introduced to
facilitate the analysis of SP and AP. TIPTrode a type of ear canal
electrode. Aural imittance measurement and or otoscopic inspection of the ear
canal is strongly advised prior to the preparation of ear canal walls or
insertion of ear canal electrodes. This will be inserted deeply in to the ear
canal, until the lateral portion reaches the tragus. When Recorded with ear
canal electrode, Wave I can be confidently identified even though it remains
undetectable with other surface inverting electrode sites such as mastoid or
earlobe (Musiek and Baran 1990).Any discomfort to the patient shold be
monitered.
TIP
trode and TM electrode (Extra tympanic recordings) are non
invasive. Responses recorded from ET sites require more signal
averaging and tend to yield small response magnitude than TT EcochG.
4) Sub dermal Needle electrodes
During
intraoperative neurophysiologic monitoring, sub dermal needle electrodes are
often used for all locations (noninverting, inverting and ground) rather than
disc electrodes. It has the advantage of secure attachment to the patient during
surgical procedure and lower impedence.Two main health risks posed by needle
electrodes are spread of disease by an unsterlized needle and needle breakage.
Should be done by appropriate medical professional

ECOCHG is ‘short’/ ‘early’ latency response,
which generally occurs with in latency of 5 ms following stimulus onset (Picton
et al 1974)
Electrode array:-
Primary (+noninverting): ear canal
/TM/promontory (Round window
Secondary (-1 inverting): contra lateral
earlobe /mastoid process /ear canal/vertex.
Common /ground: nasion/ Ipsilateral earlobe.
Electrode array: (EcochG + ABR) (5
electrodes):
·
Primary electrode (+): TM.
·
Two surface electrode (-): both ear lobe/mastoid.
·
High forhead /vertex.(+)
·
Ground: Nasion.
- TIPtrode.
The TIPtrode electrode design is shown in Figure 2.3. Placement of the TIPtrode involves
application of a small amount of abrasive liquid (e.g., NuPREP) onto a clean cotton tip swab.
Preparation and placement of the TIPtrode should be done with good lighting and direct access to the
external ear canal. First, the outer ear is pulled upward and backward to straighten and enlarge the
outer portion of the ear canal meatus. Then, the walls of this outer portion of the ear canal are
scrubbed in a circular motion with cotton tip swab. Care is taken to keep the cotton tip within sight
and not too deep into the external ear canal. Otoscopic inspection of the ear canal is strongly advised
prior to preparation of the ear canal walls or insertion of ear canal electrodes to rule out the presence
of pathology, excessive cerumen, debris, or foreign objects. The use of conducting gel or paste is not
necessary to assure adequate electrode impedance with TIPtrodes. Indeed, application of gel or paste
to ear canal electrodes may contribute to electrode slippage during testing.

Figure 2. TIPtrode combining insert earphones with an external ear canal electrode design. Arrow identifies the gold foil covered foam insert cushion coupled to an electrode wire with a special alligator clip.
Performed properly the technique just described routinely produces inter-electrode impedance values
well below the acceptable limit (< 5000 ohms). It is likely that residual abrasive liquid on the ear
canal walls is a factor in the low inter-electrode impedance. In the interest of aural hygiene, ear canal
electrodes, such as the TIPtrode, should only be used one time. Furthermore, the conducting property
of the metal foil covering the foam tip dissipates with repeated use, particularly in combination with
abrasive liquids. As proven, inter-electrode impedance for the TIPtrode is generally unacceptably
high upon second application.
Steps in the application of the TIPtrode are summarized as follows:
- An adult size TIPtrode is suitable for adult male patients. The pediatric size TIPtrode is used with women who have smaller external ear canals and for children.
- A TIPtrode insert cushion foam plug covered with gold foil is slipped onto special tubing that terminates in with an alligator clip.
- The alligator clip is coupled with the gold foil on the stalk of the insert earphone cushion.
- Verify that the insert tubing color matches the proper transducer with red tubing for the right
- Tightly compress the TIPtrode foam earplug.
- Insert the TIPtrode plug deeply into the ear canal until the lateral portion reaches the tragus.
- Verify that the patient is comfortable.
- Repeat the same process for the other ear.
- Check inter-electrode impedance to verify that impedance is < 5000 ohms.
- Begin ECochG recording.
- Tympanic Membrane Electrodes.
Gavilan & Sanjuan (1964) published one of the earliest reports of
ECochG measurement with a TM electrode location. Several years later, Cullen, Berlin, and
colleagues (1972) successfully recorded ECochG with a twisted wisp of cotton soaked in saline,
attached to the end of an electrode wire and placed on the lateral surface of the TM. Clinical
evaluation of electrodes that are inserted into the ear canal or placed on the lateral surface of the
tympanic membrane have since been described by numerous other investigators (e.g., Stypulkowski & Staller, 1987; Ruth & Lambert, 1989; Ruth and Ferraro, 1988; Lilly, 1989; Ferraro & Ferguson, 1989; Durrant, 1990; Arsenault & Benitez, 1991; Campbell, Faloon & Rybak, 1993; Ferraro et al, 1994;Laureano, McGrady & Campbell, 1995; Matsurra et al, 1996; Haapaniemi et al, 2000). The dual
motivations for development of the tympanic membrane (TM) electrode design was the advantage of
a non-invasive technique and the well-appreciated direct relationship between amplitude of the AP
component and proximity of the recording electrode to the cochlea and eighth nerve. In the words of
Stypulkowski & Staller (1987, pp. 304 and 305), this electrode was designed to "maximize response
amplitudes while minimizing clinical preparation, cleansing and insertion requirements."
One TM electrode consists of a small gauge silver wire enclosed within a flexible rubber tube
connected to either soft gel or a foam gel-infused sponge at the tip. Another design, similar to the
Cullen & Berlin (1972) electrode, substitutes a cotton wisp and saline for the sponge infused with gel
(Lilly, 1989). The cotton is soaked in saline and the electrode design is sometimes referred to as a
Lilly wick electrode. The tube is fed down the ear canal until the electrode at the tip actually makes
contact with the TM. Earphones can be placed over the bent outer portion of the flexible tube. Several
TM electrode types approved for use with patients by the United States Federal Drug Administration
(FDA) are commercially available. One of these TM electrode designs is shown in Figure 3)

Figure 3. The Lilly Wick TM electrode with an arrow pointing to the saline soaked cotton that makes contact with the tympanic membrane (Courtesy of Intelligent Hearing Systems)
Consistent with preparation for the application of any type of ear canal electrode, it is important to
first inspect the ear canal prior to insertion of tympanic membrane electrodes. Cerumen and other
debris within the ear canal should be removed by a trained health care professional prior to
placement of the electrode. After preparing the tip of the electrode with saline or conducting gel, the
electrode wire and the pliable sheath surrounding it are slowly and carefully inserted into the ear
canal. The patient is instructed to report sensations noted during the process, including any
discomfort. The ear canal should be under direct lighting. Electrode insertion with the aid of a
microscope is certainly appropriate but not necessary. The electrode is inserted until the patient
reports a pressure sensation and/or slight resistance is met. Inter-electrode impedance is then
measured. Impedance for tympanic membrane electrodes is often far higher than the typically upper
limit of 5000 ohms because the typical preparation for electrode placement cannot be done on the
tympanic membrane. The tympanic membrane electrode lead is secured when a compressed foam
cushion for insert earphones is inserted into the external ear canal.
Steps in application of the TM electrode are summarized as follows:
- Describe the procedure simply for the patient avoiding such terms as “pain”.
- Closely inspect the external ear canal for debris and any evidence of pathology.
- Apply all other electrodes except the tympanic membrane electrode, and plug pins for the
- Ask the patient to report a feeling that the electrode is resting on the TM.
- Begin inserting a clean TM electrode gradually into the ear canal.
- Secure the electrode lead temporarily with a finger once you and/or the patient sense that the electrode is resting on the TM.
- Grasp a compressed foam insert plug for an insert earphone and gently and slowly insert it into the ear canal. Pediatric sized foam inserts fit best with women and other persons with small ear canals.
- Allow the foam insert earplug to expand against the electrode lead.
- Tap the electrode lead very gently and ask the patient to report any sensation. He/she should hear a sound associated with the tapping if the electrode is resting on the tympanic membrane
- Plug the TM electrode pin into the appropriate electrode box receptacle.
- Immediately verify electrode impedance for all electrodes.
- Don’t be alarmed if the impedance for the TM electrode is excessively high (>20 K ohms).
- Begin presenting stimulation to the tympanic membrane electrode ear.
- Inspect waveform for AP component in the 1.5 to 2.0-ms region.
- AP amplitude with a TM electrode should exceed 1.0 μV, even in mild to moderate hearing loss
- If a reliable AP component is not observed, withdraw the TM electrode and reinsert as described above.
- If no AP is observed on the second attempt, remove TM electrode and inspect closely for any evidence of damage. Replace the electrode if you have any doubt about its integrity.
- Proceed with ECochG measurement and analysis.
- Trans-Tympanic (TT) Membrane Electrode.
There is abundant clinical evidence that TT placement
of a needle on the promontory yields optimal ECochG recordings. As noted earlier, the TT technique
was among the first ECochG measurement techniques described and it continues to be the technique
of choice in clinical practice when the goal is high quality recording of the CM, SP, and AP. Dozens
of authors enthusiastically recommend the TT electrode technique, citing multiple clinical advantages.
First and foremost, the amplitude of ECochG components recorded with the TT electrode technique is on the order of 15 to 25 μV and is typically much larger than for ECochG recordings with ear canal
electrode placements (e.g., Schwaber & Hall, 1990; Wuyts, van de Heyning, van Spaendonck &
Molenberghs, 1997). In comparison to other techniques, published clinical experience with the TT
electrode approach also confirms enhanced reliability, confidence in waveform analysis and optimal
test performance (sensitivity and specificity) for the diagnosis of Ménière's disease.
A needle electrode, designed for electromyography (EMG), can be used to record ECochG with the
TT approach. Earlier papers on the TT ECochG technique describe the use of rather long (> 50 mm)
needle electrodes that extended from the promontory past the pinna. These long needles were
sometimes secured partly by placement through the tragus of the external ear (e.g., Yoshie, Ohashi &
Suzuki, 1967; Sohmer & Feinmesser, 1967; Aran & LeBert, 1968). Other authors describe the use of
a "doughnut shaped headset" (e.g., Wuyts et al, 1997) with cross-lines for stabilization of the needle
within the ear canal. However, there is a simpler strategy for TT recording of the ECochG. A typical
sub-dermal needle offers some clear clinical advantages for ease of insertion and simplicity in
stabilization (Schwaber & Hall, 1990). Uninsulated needles or needles coated with Teflon insulation
except for the 0.8 mm at the tip are available in relatively short lengths of < 20 mm.
An example of a sub-dermal needle used in TT ECochG recordings is shown in Figure 4. The cable
and connector pin design is the same as those for other electrode types. The sub-dermal needle
electrode is also suitable for promontory ECochG recording and, in fact, is more convenient than
longer needle electrode designs used in early reports of ECochG clinical application. The specific
technique for placement varies depending on the type of needle that is used. The use of a steel
electrode that is coated with Teflon for insulation, except for the tip, is usually recommended (Wuyts
et al, 1997). The insulation reportedly isolates detection of electrical activity to the promontory
region, and eliminates the possibility of extraneous signals detected from other anatomic sites, e.g.,
the tympanic membrane. In the author’s experience, however, an un-insulated steel sub-dermal
electrode yields high quality ECochG recordings, with no apparent electrical contamination
(Schwaber and Hall, 1990; Hall, 1992).

Figure 4. Sub-dermal needle used for trans-tympanic promontory measurement of ECochG. Arrow points to the shaft of the needle.
A microscope is used for inspecting and viewing the TM during electrode placement. The insulated
portion of the sterile sub-dermal needle electrode between the shank and the wire is grasped with
bayonet forceps and the electrode is directed down the external auditory canal. The needle is inserted
through the posterior and inferior quadrant of the eardrum until it makes contact with the promontory.
Typically, a surgeon, e.g., an otolaryngologist, inserts the TT electrode. There are published reports
of TT membrane electrode placement without local anesthesia (Beynon, Clarke & Baguley, 1995),
although patients describe discomfort associated with the technique.
In the clinical setting, the tympanic membrane is first numbed with a local anesthetic (e.g., Phenol)
whereas in the operating room or theater the patient is under a general anesthetic (Wuyts et al, 1997;
Schwaber & Hall, 1990; Roland et al, 1995; Bath et al, 1998). A variety of local anesthetic agents
have been described, among them iontophoresis (e.g., Roland, Yellin, Meyerhoff & Frank, 1995),
combinations of phenol, menthol, and even cocaine (Bath et al, 1998). Sensation of the TM can be
easily reduced with a Phenol (89%) swab (Schwaber & Hall, 1990; Johannson et al, 1997), 10%
lidocaine (Wuyts et al, 1997), or a 2% xylocaine solution (Densert et al, 1994). The local anesthetic
is applied to the TM under microscope immediately before the ECochG procedure is performed.
Some patients report a burning sensation as the phenol contacts the TM. Iontophoresis is another
anesthetic technique reported for TT ECochG recordings (Ramsden, Gibson & Moffat, 1977;
Sirimanna, Madden & Miles, 1990). With iontophoresis, a low level of direct electrical current is
applied within the external ear canal to enhance the effectiveness of the anesthetic agent. The
technique produces adequate anesthesia, but is time consuming.
British investigators have described the reduction of discomfort during TT electrode ECochG with
the use of an anesthetic "EMLA" cream (Bath et al, 1998; Sirimanna, Madden & Miles, 1990).
Anesthetic ingredients of the cream include lignocaine and prilocaine. In a systematic study of
discomfort with 24 patients, the authors confirmed that the cream "provides a quick, simple technique
ideal for reducing the level of discomfort experienced with TT ECochG", adding that the cream was
contraindicated for patients with perforated tympanic membranes. Indeed, one formal investigation
has confirmed that patients report less discomfort with TT electrode ECochG than with the noninvasive According to Ramsden et al (1977), local anesthesia of the tympanic membrane does not affect
sensation of pain at the promontory, the actual electrode site. However, it should be noted that with
the application of local anesthesia to the tympanic membrane, most patients undergoing TT needle
placement on the promontory do not complain of discomfort (e.g., Happaniemi et al, 2000).
After TT electrode placement, the electrode lead or wire extending from just lateral to the tympanic
membrane is secured temporarily by hand against the wall of the ear canal. The physician or assistant
then grasps a compressed foam ear insert with bayonet forceps and places it within the ear canal in
the customary fashion. It is important to note that the foam ear insert is sterile for use in the operating
room during intra-operative neurophysiological monitoring. At the conclusion of ECochG recording,
the foam insert is removed first and then needle electrode is removed by pulling gently and slowly
outward.
The simplified TT promontory electrode placement procedure as described requires less than one
minute in the operating room and less than three minutes in the clinic. Although the TT electrode
technique is clearly invasive, it’s well tolerated by patients and associated medical problems and
complications are atypical. The published literature confirms that numerous clinical investigators
have successfully recorded ECochG using the trans-tympanic needle technique. In a formal
retrospective review of the medical records for 205 patients who underwent TT ECochG recording,
Ng, Srireddy, Horlbeck & Niparko (2001) reported one case of a non-healed persistent perforation
with acute otitis media was attributed to the TT technique. Another two patients developed otitis
media with intact tympanic membranes. And three patients described ear pain for up to five days.
These authors concluded from their chart review and patient survey that complications from the TT
electrode technique were infrequent and patient acceptance was good. TM electrode technique
(Haapaniemi et al, 2000).
Stimulus Parameters
- Transducer
Advantages of insert earphones cited in Chapter 1 for auditory evoked response
measurement in general apply as well to ECochG recording. At least three advantages of insert
earphones in the measurement of ECochG are particularly noteworthy. First, because the ECochG
components occur within the first two or three milliseconds in the waveform, analysis can be
enhanced by elimination of stimulus artifact within this time frame by separation of the transducer box from the electrode site via the insert tubing. Stimulus artifact may be indistinguishable from ECochG components and can seriously interfere with their confident identification.
Secondly, insert earphones contribute to the quality of recordings for each of the three major ECochG
electrode options. The TIPtrode electrode is an insert earphone cushion covered with gold foil and
coupled via an electrode lead to a pre-amplifier. TM electrode and TT electrode lead wires within
the ear canal can be effectively held in place and secured with insert earphone cushions, as illustrated
in this chapter. Third, insert earphones offer a clear advantage over conventional supra-aural
earphones for intra-operative monitoring with ECochG during surgical operations involving the ear
or auditory system. The tubes and insert cushions are necessarily within the surgical field for patients
undergoing surgical procedures such as acoustic tumor removal or vestibular nerve section. The
insert tubing and foam cushions can be sterilized prior to surgery and placed in the surgical field
before the ear and mastoid region is bathed with a liquid disinfectant. Furthermore, the foam insert
cushions are routinely discarded after surgery. As illustrated in Figure 5, placement of insert
earphones does not interfere with access to the post-auricular area during surgical procedures.

Figure 5. Insert earphone tubing and foam cushion and wire for a trans-tympanic needle electrode immediately prior to intra-operative neurophysiological monitoring with a combination ECochG and ABR technique. Arrows point to yellow insert cushion, insert tubing (red arrow), and white electrode wire.
- Type of Stimulus.
Click signals are most commonly used in clinical ECochG measurement. This
statement holds true regardless of the application, including enhancement of the wave I component of
the ABR, intra-operative monitoring, diagnosis of Ménière's disease, and diagnosis of auditory
neuropathy spectrum disorder. Each of these applications is discussed in the next chapter. The click is
produced with a 0.1-ms (100-msec) electrical pulse as it is for ABR measurement. ECochG can be
elicited with tone burst signals (Campbell, Faloon, Rybak, 1993; Orchik, Shea & Ge, 1993; Ge &
Shea, 2002; Laureano, McGrady & Campbell, 1995; Ferraro et al, 1994; Schoonhoven, Fabius &
Grote, 1995; Schoonhoven, Prijs & Grote, 1996; Noguchi, Nishida & Kamatsuzaki, 1999). ECochG
measurement with tone burst signals is most often applied in the diagnosis of Ménière's disease (e.g.,
Arakawa, 1998; Campbell, Harker & Abbas, 1992; Margolis et al, 1995; Orchik, Shea & Ge, 1993).
There is some evidence that the diagnostic value of ECochG is relatively higher for a 1000 Hz tone
burst signal frequency (e.g., Conlon & Gibson, 1999, 2000; Gibson, 1991; Sass, 1998; Sass et al,
1998). The confident detection of ECochG components evoked with tone burst signals, particular for
lower frequencies, is significantly greater for TM and TT electrode recordings than for ECochGs
recorded from more distant electrode sites such as the external ear canal.
- Stimulus Duration.
Stimulus duration differentially affects ECochG components. An abrupt-onset
stimulus like a click or tone burst is required for generation of the ECochG AP component, and the
response is not consistently detected with stimulus rise times exceeding about 10-ms. Only the onset
portion of the stimulus contributes to the response. Since dependency of the AP component of
ECochG AP on stimulus duration characteristics is similar to wave I of the ABR, general concepts of
rise/fall and plateau times for both responses are presented in Chapter 5 in a review of stimulus
parameters in measurement of ABR.
In contrast to the AP, the SP component and to a lesser extent the CM component of ECochG is
dependent on stimulus duration. The CM and SP can be generated with a wide range of stimulus
rise/fall times and each component can persist throughout the duration of tonal stimulation. At one
extreme, CM and SP activity is easily recorded with a very abrupt (0.1-ms) click stimulus. As noted
already, a single polarity rarefaction or condensation polarity stimulus must be used to detect the CM.
At the other extreme, CM and SP components can be generated with stimuli having relatively long
rise times and extended durations. Measurement of ECochG with long-duration tone burst signals of
50-ms or more is reported for diagnosis of Ménière's disease (e.g., Arakawa, 1998; Densert et al,
1994). The SP component appears as a shift in baseline electrical activity that directly reflects
stimulus duration as illustrated in Figure 6.

Figure 6. Relation between tone burst stimulus duration and the SP versus AP components of ECochG.
In fact, extending the duration of a tone-burst stimulus to 10-ms or longer is a clinical strategy for
clarifying the presence of the SP and distinguishing SP versus AP components of the ECochG. The SP persists for the duration of the stimulus, whereas the AP appears only immediately following stimulus onset. The distinctly different effect of stimulus duration on SP versus AP has long been recognized in clinical applications of ECochG (e.g., Dauman, Aran, Sauvage, & Portman, 1988).
- Stimulus Intensity
Basic information on physiology and anatomy of ECochG, important for
understanding the effects of intensity was reviewed earlier in this chapter. The receptor potentials of
the cochlea include the SP component, reflecting DC activity, and the CM component reflecting AC
(alternating current) activity. Neither the generation of the CM or the SP involves a synapse because
they are receptor potentials and pre-neural. That is, each potential is generated within the cochlea as
soon as the cochlea is activated by an acoustic stimulus and before the first synapse from inner hair
cells to eighth-nerve afferent fibers. As a result, stimulus intensity has little or no effect on the latency
of either component of the ECochG. The onset of CM can, in fact, be used as a stimulus onset marker
in ECochG measurement.
Amplitude of both the CM and the SP does increase with intensity. The CM is the AC potential that
closely follows the vibratory pattern of the basilar membrane, including the amplitude and the phase
of its displacement (Dallos, 1973; Davis, 1958), and its amplitude directly reflects stimulus
amplitude. Higher stimulus intensity levels produce greater basilar membrane displacement and
proportionally greater CM activity. As noted previously, evidence of CM waveform in the ECochG
recording can be minimized or eliminated with the use of alternating polarity stimuli. CM
cancellation with stimulus polarity reversal is, however, most effective only for lower stimulus
intensity levels (Peake & Kiang, 1962). Amplitude is equivalent for each polarity and phase is
exactly reversed at lower stimulus intensities. At higher stimulus intensity levels, CM cancellation
may be incomplete because of slight differences or distortions in phase and amplitude of the response
for one polarity versus the other. The phase differences are presumably due to distortion in
production of the CM within the cochlea.
The SP is the DC cochlear potential (Dallos, Schoeny, & Cheatham, 1972; Honrubia & Ward, 1969).
Unlike the AP component and the CM, the SP is typically recorded only at high intensity levels
(Davis, 1958; Davis, Deatherage, Eldredge, & Smith, 1958). As noted earlier in the chapter, inner
hair cells play an important role in the generation of the SP (Durrant et al, 1998; Dallos, 1973). There
is experimental evidence of a relationship between the amplitude of the AP (scala media negative) to
the RMS (root mean square) SPL of a tonal stimulus (Davis, 1959). The normal human SP is first
detected at a click intensity level of about 92 dB SPL, or approximately 62 dB nHL. Amplitude of the
SP component gradually increases as click intensity level increases (Chatrian, Wirch, Edwards,
Lettich, & Snyder, 1984; Eggermont, 1976a,b; Eggermont & Odenthal, 1974a,b).
Chatrian et al (1984) described with a power function the relationship of amplitude versus intensity
for an ECochG recorded from the ear canal:
log SP amplitude in mV = b log click SPL + log k,
where b is the exponent if the logarithmic function and k is the intercept of the function.
Synaptic delay is another factor influencing latency of the AP component of ECochG. This delay is
considerably less when ECochG is recorded at high versus low stimulus intensity levels. The latency
changes due to synaptic delay are equivalent for all stimulus frequencies. One important principle of
ECochG measurement, especially for audiometric assessment, is evident from these comments.
Frequency specificity in ECochG generation is greatest for lower intensity levels and is reduced for
higher stimulus intensity levels.
- Stimulus Rate.
CM and SP components of ECochG remain relatively stable over a wide range of stimulus rates. In contrast, latency of the AP component increases and amplitude decreases as
stimulus rate increases (Mouney, Berlin, Cullen, & Hughes, 1978; Wilson & Bowker, 2002). As
signal rate increases, the SP/AP ratio increases due to the relative decrease in amplitudes for the AP
versus the SP component. At signal rates approaching 100 sec, the AP is minimal and detection of the
remaining SP is enhanced. These relationships between signal rate of presentation and ECochG
amplitude values are illustrated in Figure 7. The mechanism for rate-related changes in AP
component latency and amplitude may be due to de-synchronization at the cochlear level and perhaps
to an adaptation phenomenon at the synapse between hair cells and auditory nerve afferents
(Eggermont, 1974). In any event, inclusion of a fast signal rate into the clinical ECochG test protocol
is useful for confirmation of the SP component and accurate calculation of SP amplitude.

Figure 7. Effect of stimulus rate on the SP versus AP components of ECochG
- Stimulus Polarity.
Signal polarity has a marked and differential influence on the three ECochG
components. The effect of stimulus polarity on responses from the cochlea and the eighth nerve was
demonstrated experimentally with studies employing single unit recordings (Anderson, Rose, Hind, &Brugge, 1971; Burkard & Voigt, 1989 a, b; Coats et al, 1979; Eggermont, Spoor, & Odenthal, 1976;
Gerull et al., 1985; Kiang, 1965; Møller, 1986; Peake & Kiang, 1962; Pfeiffer, 1974; Pfeiffer & Kim,
1972; Teas et al, 1962). Clinically, signal polarity effects are evident with averaged ECochG
recordings. The CM component is recorded for single rarefaction or condensation polarity signals.
The direction of the CM changes in the waveform is approximately180 degrees out of phase for one
polarity versus the other. With an alternating polarity signal when rarefaction and condensation
polarity signals are presented in alternate sequence, the CM is mostly cancelled out. The SP and AP
components of ECochG are more readily detected when the CM is cancelled in this way. It is
important to keep in mind, however, that only ECochG components elicited with single polarity
signals are true electrophysiological responses, whereas the waveform produced by alternating
polarity signals is really derived from two individual responses (Sass et al, 1998). Each of these
responses to a signal polarity can be influenced by differences in noise content and signal averaging.
Effect of stimulus polarity on the ECochG is illustrated very simply in Figure 8.

Figure 8. Illustration of the effect of stimulus polarity on components of ECochG
- Bone Conduction ECochG.
Although it’s technically possible to evoked ECochG with bone
conduction stimulation, the technique is not applied in clinical settings. Stimulus-related artifact is a
major problem in recording bone conduction ECochG because the artifact extends well into the time
period of the response and may obscure the individual components of the response. Klyen, Harder,
Jerlvall, and Arlinger (1982) and Harder, Arlinger, and Kylen (1983), citing the limitations of
conventional bone vibrators and placement techniques such as placement on intact skin over the
mastoid bone, assessed the performance of a piezo-ceramic accelerometer, the A21T, attached to the
mastoid process with a modified bone screw. Data with these two types of bone vibrators and
placements were reported for cadavers and for patients. Although mounting the B-72 vibrator to the
skull with a screw reduced distortion of the skull vibration pattern, the authors still found excessive
distortion for high-frequency stimuli and excessive electromagnetic stimulus artifact.
- Monaural versus Binaural Stimulation.
Effects of monaural versus binaural stimulation have been
studied mostly for ABR and AMLR, as reviewed in later chapters. One study of monaurally versus
binaurally evoked ECochG waveforms showed rather interesting results that differed considerably
from those for later latency responses. Prasher and Gibson (1984) recorded the ECochG from 30
subjects using a TT needle electrode resting on the promontory. Stimuli were clicks presented via
TDH-39 earphones. For 87% of the subjects, the peak-to-peak amplitude of the AP component was
diminished for binaural versus monaural stimulation. Magnitude of the binaural amplitude decrease
varied considerable among subjects, ranging from no change to 75%, with an average decrease of
about 30%. The mean reduction in AP amplitude for the group corresponded to the effect of a stimulus intensity attenuation of 20 dB. Despite these distinct amplitude changes, AP latency remained equivalent for monaural versus binaural stimulation. The efferent auditory system presumably plays a
role in these findings. Efferent system activation by electrical stimulation produces both an inhibitory
effect on the eighth-verve AP (Galambos, 1956) and an enhancement of the CM. Other factors
probably contribute to the paradoxical decrease in the amplitude of the AP with binaural stimulus.
Acquisition Parameters
- Analysis Time.
An analysis time in the range of 5 to 10-ms is typically used for ECochG
measurement. With a minimum of 512 data points distributed across this period, temporal resolution
defined as the time interval between any two consecutive sample points is 0.02-ms or less. Temporal
resolution is more than adequate to define response waveform in analysis of ECochG. A relatively
brief analysis time of 5 m may be preferable for pure measurement of the ECochG with click
stimulation because potentially larger amplitude and later latency brainstem components are
eliminated from analysis. However, if the clinical objective is combined recording of ECochG and
ABR, or if lower frequency tone burst stimulation is used, then a 10-ms or even 15-ms analysis time
is appropriate for ECochG. Latency of the ECochG AP component is prolonged for lower frequency
tonal stimuli such as 500 Hz or 1000 Hz tone bursts especially when they are presented at lower
intensity levels or to patients with peripheral auditory deficits. In these instances, an analysis time of
greater than 5-ms is required to insure that the entire response is visible.
- Filter settings.
The CM contains energy in the spectrum of the stimulus since it is a reflection of
stimulus polarity and frequency. Filter settings should be sufficiently wide to encompass these
frequencies and to avoid any distortion of CM phase. The SP presents a unique problem in filtering.
As a DC potential, theoretically the SP is best recorded with little or no high pass filtering. In fact,
band-pass filter settings of 3 or 10 to 1500 or 3000 Hz are typically described in reported ECochG
test protocols. Clinically, extending the high pass filter setting to such extremes as 0.1, 1, 3, 5 or even
10 Hz may introduce irrelevant EEG activity and substantial patient related artifact. Both sources of
unwanted electric activity may interfere with rapid data collection. There is clinical evidence that a
distinct SP component can be recorded with high pass filter settings in the range of 10 to 30 Hz, and
even 100 Hz (e.g., Ferraro & Durrant, 1989; Durrant & Ferraro, 1991), with no detectable change in
the SP/AP ratio. For ECochG applications that rely on SP measurement, such as diagnosis of
Ménière's disease, extending the high pass filter setting to below 100 Hz is certainly preferable but
not essential.
- Amplification.
You may recall from reading Chapter 1 that amplification in auditory evoked response
measurement depends on the size of the response. Less amplification of recorded brain activity is
required for large responses and more amplification is needed for small responses. The amount of
amplification required in measurement of ECochG depends very much on the electrode technique.
High amplification of X100,000 used with ABR is necessary also when ECochG is recorded with an
external ear canal electrode. All ECochG components are relatively small, perhaps less than 0.5
μvolt, when detected with far-field electrode location. On the other hand, relatively modest amounts
of amplification are needed when ECochG is recorded using a near-field recording technique with an
electrode on or near the promontory because responses have amplitudes exceeding 10 and sometimes
20 μvolts.
- Number of Sweeps or Number of Stimulus Repetitions.
The number of sweeps or repetitions of stimuli is an indication of the amount of signal averaging necessary for recording a reliable ECochG waveform. The noise level during recording and the size of the response determines the necessary amount of averaging. The goal in auditory evoked response measurement is to obtain an adequate signal to noise ratio in the shortest possible test time. As just explained, electrode type is a critical factor in the size of the response. A true near-field electrode placement on the promontory or even a tympanic membrane electrode site typically produces a robust signal, the ECochG, with amplitude of 2 to over 10 μV.
ECochG Recording Problems
Although the list of general problems that may develop in ECochG recording is long, many can be
solved with optimal electrode placement. ECochG activity arising from the cochlea and distal
(cochlear end) eighth nerve is best measured with a 'near field' technique, with the electrode near the
electrical field (dipole) generating the recorded response. Therefore, as the recording electrode
approaches the cochlea, response amplitude increases substantially. For a normal ear, ECochG SP or
AP components detected with a promontory electrode (resting on the outer wall of cochlea) are from
10 to even 20 times larger than those detected with an electrode located in the ear canal. The large
amplitude the near field ECochG response serves to overcome various measurement problems
encountered clinically. Response reliability or repeatability, often poor with ear canal electrodes, is
typically excellent with the promontory electrode site. With a promontory or TM electrode, ECochG
is usually identified confidently even from patients with serious hearing impairment, whereas these
patients usually do not show a clear response with a more distant electrode site. Finally, because the
near field response is so much larger, the signal to noise ratio is corresponding smaller. The clinical
advantage is that far fewer sweeps (stimulus repetitions) are required to detect a response.
RECIPE FOR RECORDING ECOCHG
Test Protocol: Stimulus Parameters.
A guideline for stimulus parameters in a clinically useful test
protocol for recording ECochG is summarized as follows:

Comment on Stimulus Parameters. Even though clinical research of ECochG dates back to 1930
and clinical application to the 1940s, there is no standard test protocol. Transducer type is optional.
Insert earphones are certainly not required, but the many advantages of insert earphones noted are all pertinent for evoking cochlear responses. There are two added advantages on insert
earphones specific to ECochG measurement. One is the option of adapting the insert earphone to
serve as a TIPtrode. The second advantage applies to ECochG measurement with either a tympanic
membrane electrode or a trans-tympanic needle electrode. With the tympanic membrane electrode, the insert earphone cushion can be used to secure the electrode wire against the ear canal wall and the
end of the TM electrode against the TM. The insert earphone cushion also secures the wire for the
trans-tympanic electrode against the external ear canal wall, and maintains the tip of the needle at the
promontory, as shown earlier in Figure 5.
The type of stimulus is also optional. Clicks are by far the most commonly reported stimulus for
eliciting the ECochG, but the response can also be evoked with tone burst stimuli. Research suggests
that tone bursts are a more effective stimulus option for selected clinical applications of ECochG.
Brief stimulus duration is essential for producing the synchronous firing of afferent auditory nerve
fibers required for generating compound action potentials. Stimulus polarity is also a critical
parameter for ECochG measurement. Alternating polarity stimuli are required to detect a clear SP.
The use of alternating polarity stimuli is necessary for ECochG applications that rely on analysis of
amplitude ratio for the SP versus the AP, particularly the diagnosis of Ménière’s disease. Single
polarity stimuli … rarefaction and condensation … are required to elicit the CM response. Detection
of a clear CM is an objective in the identification of auditory neuropathy spectrum disorder. The
choice for stimulus polarity, therefore, depends on the clinical application of the ECochG
measurement.
As a rule, slower stimulus rate is associated with larger ECochG amplitude. However, with a near
field electrode technique (e.g., trans-tympanic electrode), the response is typically robust and faster
rates still produce adequate amplitudes for ECochG components. A very fast stimulus rate, e.g.,
91.1/sec, is useful in differentiating the SP and the AP components. As stimulus presentation rate
increases, amplitude of the action potentials (the AP component) gradually decreases. In contrast, SP
amplitude remains unchanged. Stimulus intensity is typically high in measurement of ECochG when
the goal is simply to generate a clear and highly reliable response. However, in patients who cannot
be assessed behaviorally and who lack a clear and reliable ABR wave V, it is possible to estimate
auditory threshold with the AP component at lower intensity levels.
Test Protocol: Acquisition Parameters.
Acquisition parameters in a clinically useful test protocol for recording ECochG is summarized as follows:

Comment on Acquisition Parameters. The importance of the location and type of the electrode in
ECochG measurement has been repeatedly emphasized in this chapter. ECochG quality … amplitude,
morphology, and repeatability … is superior with trans-tympanic membrane placement of a needle on
the promontory. Placement of a silver ball electrode in the round window niche is equally effective
for detection of the best possible ECochG, but is certainly not as convenient. The TM electrode
design offers the optimal non-invasive approach for recording a clear and easily detectable ECochG.
The TM electrode is the ideal option for audiologists lacking medical support who are recording
ECochG from adults undergoing diagnostic assessment. The TM electrode usually permits confident
identification of all ECochG components.
The TIPtrode is the least useful option and, some would argue, not even worthy of the label “an
ECochG electrode.” The TIPtrode is adequate for detection of the AP component, or ABR wave I, in
most patients except in those with severe high frequency hearing loss. However, the TIPtrode really is
not sufficient for consistently confident detection of the SP component even for patients with modest
degrees of sensory hearing loss. Finally, the number of sweeps required in ECochG measurement is
highly dependent on the signal-to-noise ratio, and mostly on the magnitude of ECochG components.
As few as 50 to 100 sweeps are needed to detect an unequivocal response when a very large ECochG
is recorded with a trans-tympanic membrane electrode, whereas 2000 or more sweeps might be
needed before an AP component emerges in attempts to record the ECochG with the TIPtrode
electrode option.
- ECochG Measurement Strategy.
Steps in a general approach for ECochG measurement strategy are summarized as follows:
- If it is feasible, obtain and analyze the patient's audiogram. Assess low and high frequency hearing status. Decide on the most appropriate inverting electrode type (e.g., ear canal, tympanic membrane, trans-tympanic needle).
- Set up the equipment.
- Instruct and prepare the patient.
- Apply scalp and inverting electrodes and verify impedance.
- For trans-tympanic (TT) electrode placement by a physician, anesthetize the eardrum.
- Place the TT electrode while visualizing the tympanic membrane under microscope.
Insert the cushion (earplug) into the ear canal, and attach the tubing to the transducer box.
Verify TM electrode impedance. Recheck impedance to assure proper TM electrode placement. Note
that TM electrode impedance is typically very high.
It is appropriate to proceed with ECochG recording even when impedance is too high to be
established. Adequate TM electrode placement is then verified by the presence of ECochG
components with expected amplitude values in the recording :
- Record replications of at least three separate responses at a high click stimulus intensity level, such as 80 to 95 dB HL.
- Verify that the ECochG components are reliably recorded. For diagnosis of Ménière's disease, calculate from the sum of waveform replications the SP and AP latency and amplitude, and calculate SP/AP amplitude ratio.
- Compare the SP/AP ratio to normative data collected with equivalent measurement parameters and also compare the inter-ear symmetry of the ECochG SP/AP ratio for the patient.
WAVEFORM ANALYSIS
- Introduction.
The ECochG test protocol just reviewed dictates the specific components that will be
recorded. The CM is best detected with single polarity rarefaction or condensation signals. As noted
earlier, the SP and AP are clearer when ECochG is evoked with alternating polarity signals or the
responses for each of the single polarity stimuli are mathematical summed after recording is
complete. ECochG components almost always occur within the first two to three milliseconds after a
transient acoustic stimulus, such as a click or tone burst. Latency of the response is relatively
consistent. Response morphology and amplitudes are, however, highly dependent on a variety of
measurement parameters such as stimulus intensity, rate, and polarity, and electrode location.
We’ll now discuss briefly four general ECochG analysis strategies:
1) calculation of the amplitude of the major components and a comparison of the relative amplitudes for the SP and AP components, i.e., the SP/AP ratio;
2) latency analysis for the AP component and comparison of the latency
difference for the AP component evoked with signals of rarefaction versus condensation polarity,
3)calculation of the duration of the SP and AP complex and, in a variation of this analysis approach,
4) calculation of the area under the SP and AP components. For clinical applications of ECochG, the
calculations made with each of these four analysis approaches are usually compared to normative
data that were collected with an equivalent test protocol.
- Latency Analysis.
Calculation of the absolute latency of components of any auditory evoked
response is a fundamental analysis strategy. For all clinical applications of ECochG, one of the initial
steps in waveform analysis is identification of a reliable AP component and manual measurement of
the AP latency using a cursor to mark the peaks. Simple latency and amplitude analysis of the SP and
AP components is illustrated in Figure 9. In normal ears, latency is slightly shorter for AP
components evoked with rarefaction versus condensation signals.

Figure 9. Analysis of latency and amplitude of the ECochG components
- Amplitude Analysis.
The typical ECochG waveform and labeling schema are also shown in Figure
9. Typically, the peak in SP and AP amplitude in μV is calculated from a baseline. The use of a prestimulus period of averaging, such as 1 to 2-ms, facilitates determination of a stable waveform
baseline for these measurements. Some authors describe measurement of the SP amplitude from the
baseline to the notch between the SP and AP peaks, rather than the actual peak of the SP (e.g., Ge &
Shea, 2002). With tone burst signals of extended duration, the SP amplitude can also be measured
from a point on the SP plateau after the AP to the pre- or post-SP baseline. This strategy is illustrated
in Figure 9. Early investigations of ECochG as a diagnostic procedure in Ménière's disease noted
the large inter-subject variability in the absolute amplitude of SP and the AP components (e.g., Coats
1981). In contrast, the SP/AP ratio was more repeatable because both components were recorded in
the same individual under identical measurement conditions. The SP/AP ratio stated as a fraction
(e.g., 0.4) or a proportion (e.g., 40%) is calculated by dividing the SP amplitude by the AP amplitude.
For the application of ECochG in diagnosis of Ménière's disease, the most common analysis
approach is the calculation of SP and AP amplitude in μV from a common baseline and then the
calculation of the SP/AP ratio as depicted in Figure 9. When ECochG components are large and
noise is minimal, analysis and calculations can be made from a single averaged waveform. However,
with most recordings the confident analysis of ECochG waveforms is improved by performing
latency and amplitude calculations on the sum of two or more waveforms after each is first averaged
separately. A horizontal electrode array may be useful in enhancing the AP component in ECochG analysis (Hall, 1992; Yellin & Chase, 1991). A horizontal array waveform can be derived by subtracting from a waveform recorded with the ipsilateral electrode array the corresponding waveform recorded with the contralateral electrode array. A copy of one of these waveforms is first made to preserve the separate replications. The repeatability of the SP and AP components is carefully evaluated. Then, these derived horizontal waveforms are summed. SP and AP analysis of latency, amplitude, and the SP/AP amplitude ratio is made from the summed waveform. Finally, replications are overlaid, and all waveforms are plotted. To save test time, analysis of ABR and ECochG data for the ear that is stimulated first can be made while waveforms are averaged for the second ear.
- Duration Analysis.
Beginning with the earliest published reports of ECochG in the diagnosis of
Ménière's disease, duration or width of the SP and AP components in combination has been offered as a measurement parameter for ECochG (Ferraro & Tibbils, 1999; Ge & Shea, 2002). This analysis
strategy is rarely utilized in other clinical applications of ECochG. Time in milliseconds is
determined from the beginning to the end of the SP/AP complex. The initial width measurement point is the deviation from baseline of the leading edge of the SP/AP wave complex. A straight line fromthe baseline preceding the SP/AP complex is extended out in time to the right on the X-axis. The
width of the SP/AP portion of the waveform is defined in milliseconds from the onset to the point
where the waveform returns to the baseline.
The suspected mechanism underlying the prolongation in the SP/AP width, at least in Ménière's
disease, is slowed velocity of the traveling wave within the cochlea. The slower traveling wave
presumably results from restricted basilar membrane movement with increased loading in
endolymphatic hydrops (Ferraro & Tibbils, 1999). Preliminary evidence suggests that ECochG
sensitivity in the diagnosis of Ménière's disease may also be enhanced by analysis of the SP/AP area
measure, especially in patients whose diagnosis was categorized as probable rather than definite.
- Area-Under-the-Curve.
A third ECochG analysis strategy involves calculation of the area
encompassed by the SP/AP waveform complex, a measure referred to as the "area under the curve."
The product of this calculation is essentially a combination of the data from analysis of amplitude
plus width. Indeed, one motivation for the development of this analysis approach is an appreciation
that the SP/AP ratio has less than optimal sensitivity (60 to 65%) in the diagnosis of Ménière's
disease. Relatively few investigators have employed this promising technique, perhaps because
calculation of area under the ECochG curve was not available as an option with clinical ECochG
systems (Morrison et al, 1980; Ferraro & Tibbils, 1999; Ge & Shea, 2002).
CONCLUDING COMMENTS
For assessing cochlear function, regardless of the actual clinical objective, the auditory evoked
response technique of choice is ECochG. The overall objective in measurement of ECochG is
confident identification of CM, SP and/or AP components. The specific procedure to be followed,
particularly the electrode type used, will vary depending on a variety of factors, including the
diagnostic objective, hearing status, whether the patient is a young child versus an adult), and the
availability of medical support. Although patient comfort is a factor in the decision regarding
electrode type (Beynon, Clarke, Baguley, 1995), most patients will gladly tolerate some discomfort
for procedures that are likely to contribute to the diagnosis of their disorder. The principles and
protocols reviewed in this chapter can be directly applied in the clinical application of ECochG in
specific patient populations. Two specific examples of the clinical application of ECochG are
diagnosis of auditory neuropathy spectrum disorder and Ménière's disease. The application of
ECochG in these and other patient populations is reviewed in the next chapter. ECochG principles
and techniques also can be applied in various clinical applications of the ABR, as reviewed


Comments
Post a Comment